Meta Description:
Most dyno operators miss a critical blind spot: they’re measuring power without truly understanding the inertia calculations that make those numbers meaningful. Vehicle rotational mass directly distorts your test results, yet five specific formulas remain unknown to technicians who should master them. Get the equations that separate guesswork from precision, and stop accepting performance data you can’t verify. The first formula will change how you read every dyno session.
Why Dynos Simulate Vehicle Mass: The Inertia Principle
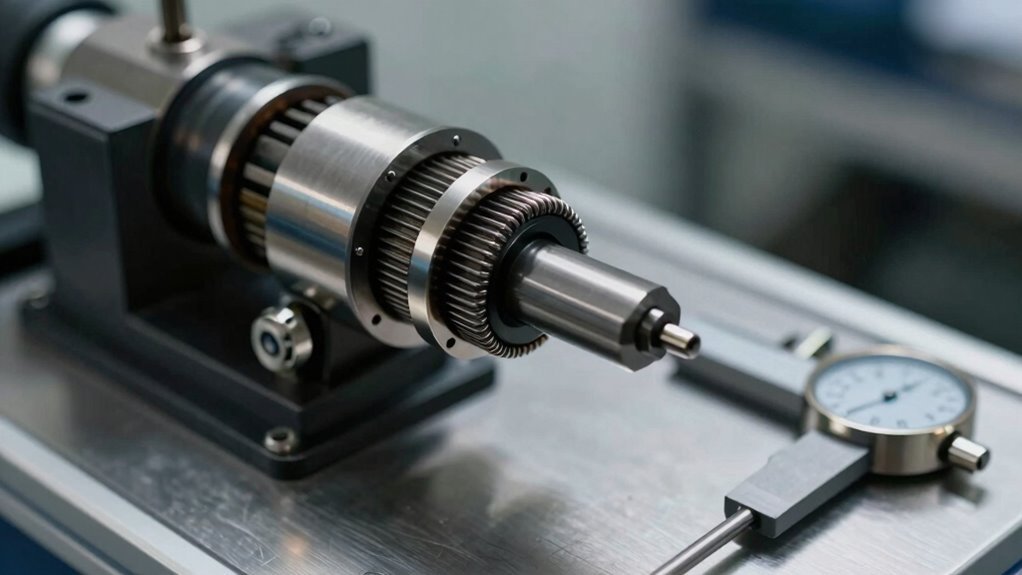
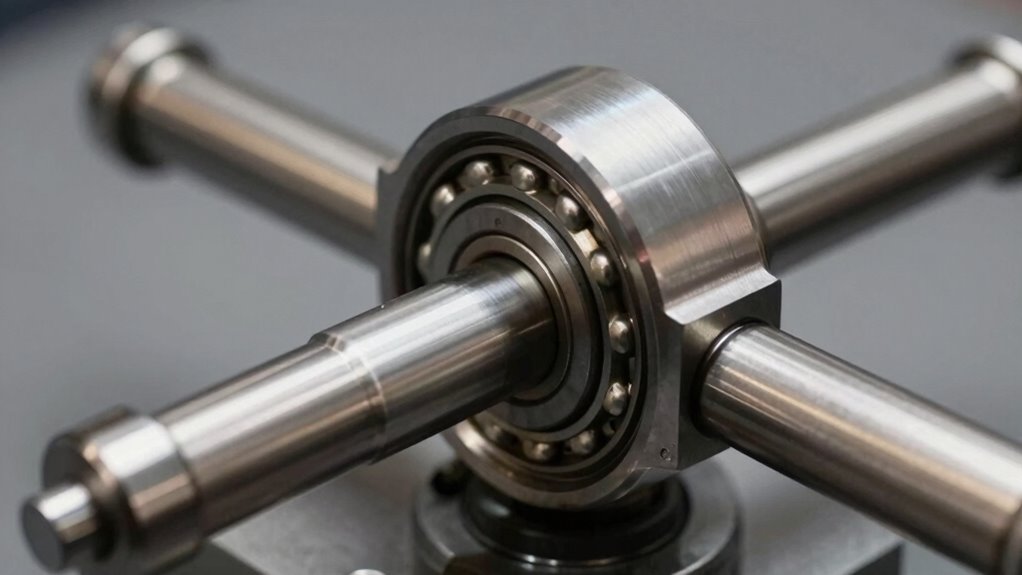
At the heart of dynamometer testing lies a straightforward but powerful concept: a precisely weighted drum that rotates beneath a vehicle’s drive wheels creates the same resistance to acceleration that the vehicle itself encounters on the road.
This drum’s inertia effects mirror real-world driving conditions, where a vehicle must overcome its own mass during acceleration. The mass simulation provided by the drum’s weight guarantees that dyno testing reflects actual performance behaviour, not theoretical metrics. Sensors embedded in the dyno track drum acceleration rate to provide real-time data collection across different RPM ranges. Our cutting-edge software solutions continuously process this acceleration data to ensure maximum precision in your performance measurements.
Engineers and technicians rely on this principle because it delivers repeatable, accurate measurements of how vehicles behave under load. By grasping inertia principles, operators can confidently interpret results and make informed decisions about vehicle modifications, knowing the data reflects genuine on-road acceleration characteristics rather than inflated laboratory readings.
Calculate Equivalent Vehicle Mass From Inertia
The conversion from rotational inertia to equivalent vehicle mass represents a critical interpretation layer in dynamometer operations, allowing operators to interpret drum behaviour in terms drivers and engineers immediately comprehend.
The core formula, EM = I / r², alters moment inertia into equivalent mass by dividing total inertia by roller radius squared.
EM = I / r² converts moment inertia into equivalent mass by dividing total inertia by roller radius squared.
This equivalent mass calculation accounts for all rotating components—rollers, shafts, and absorbers—combined with vehicle drivetrain elements.
Precise calculations sum individual inertia values before applying the conversion, ensuring accuracy across different speed ratios and gear configurations. Our state-of-the-art testing facilities enable operators to perform these calculations with the precision necessary for reliable results.
The resulting equivalent mass simulates how the vehicle accelerates on road conditions, excluding aerodynamic resistance. Wheel inertia has the greatest impact on equivalent mass due to larger diameter rollers reducing rotational speed and inertia effects.
Operators use this figure to validate power measurements and confirm that dynamometer loading matches real-world vehicle behaviour, creating repeatable, scientifically valid test data.
Understand How Gear Ratios Affect Dyno Readings
Because gear ratios directly influence how power transfers from the engine to the dynamometer’s measuring rollers, operators must recognise that a vehicle’s gearing setup fundamentally alters dyno readings independent of actual engine output.
Gear Performance and Acceleration Impact
Higher numerical ratios accelerate faster, compressing the speed range on dyno graphs. This acceleration impact creates a critical measurement challenge: shops confirm that horsepower and torque readings decrease after gear upgrades, despite unchanged engine power.
A 620 hp baseline may read 574 hp post-installation, though engine output remains constant.
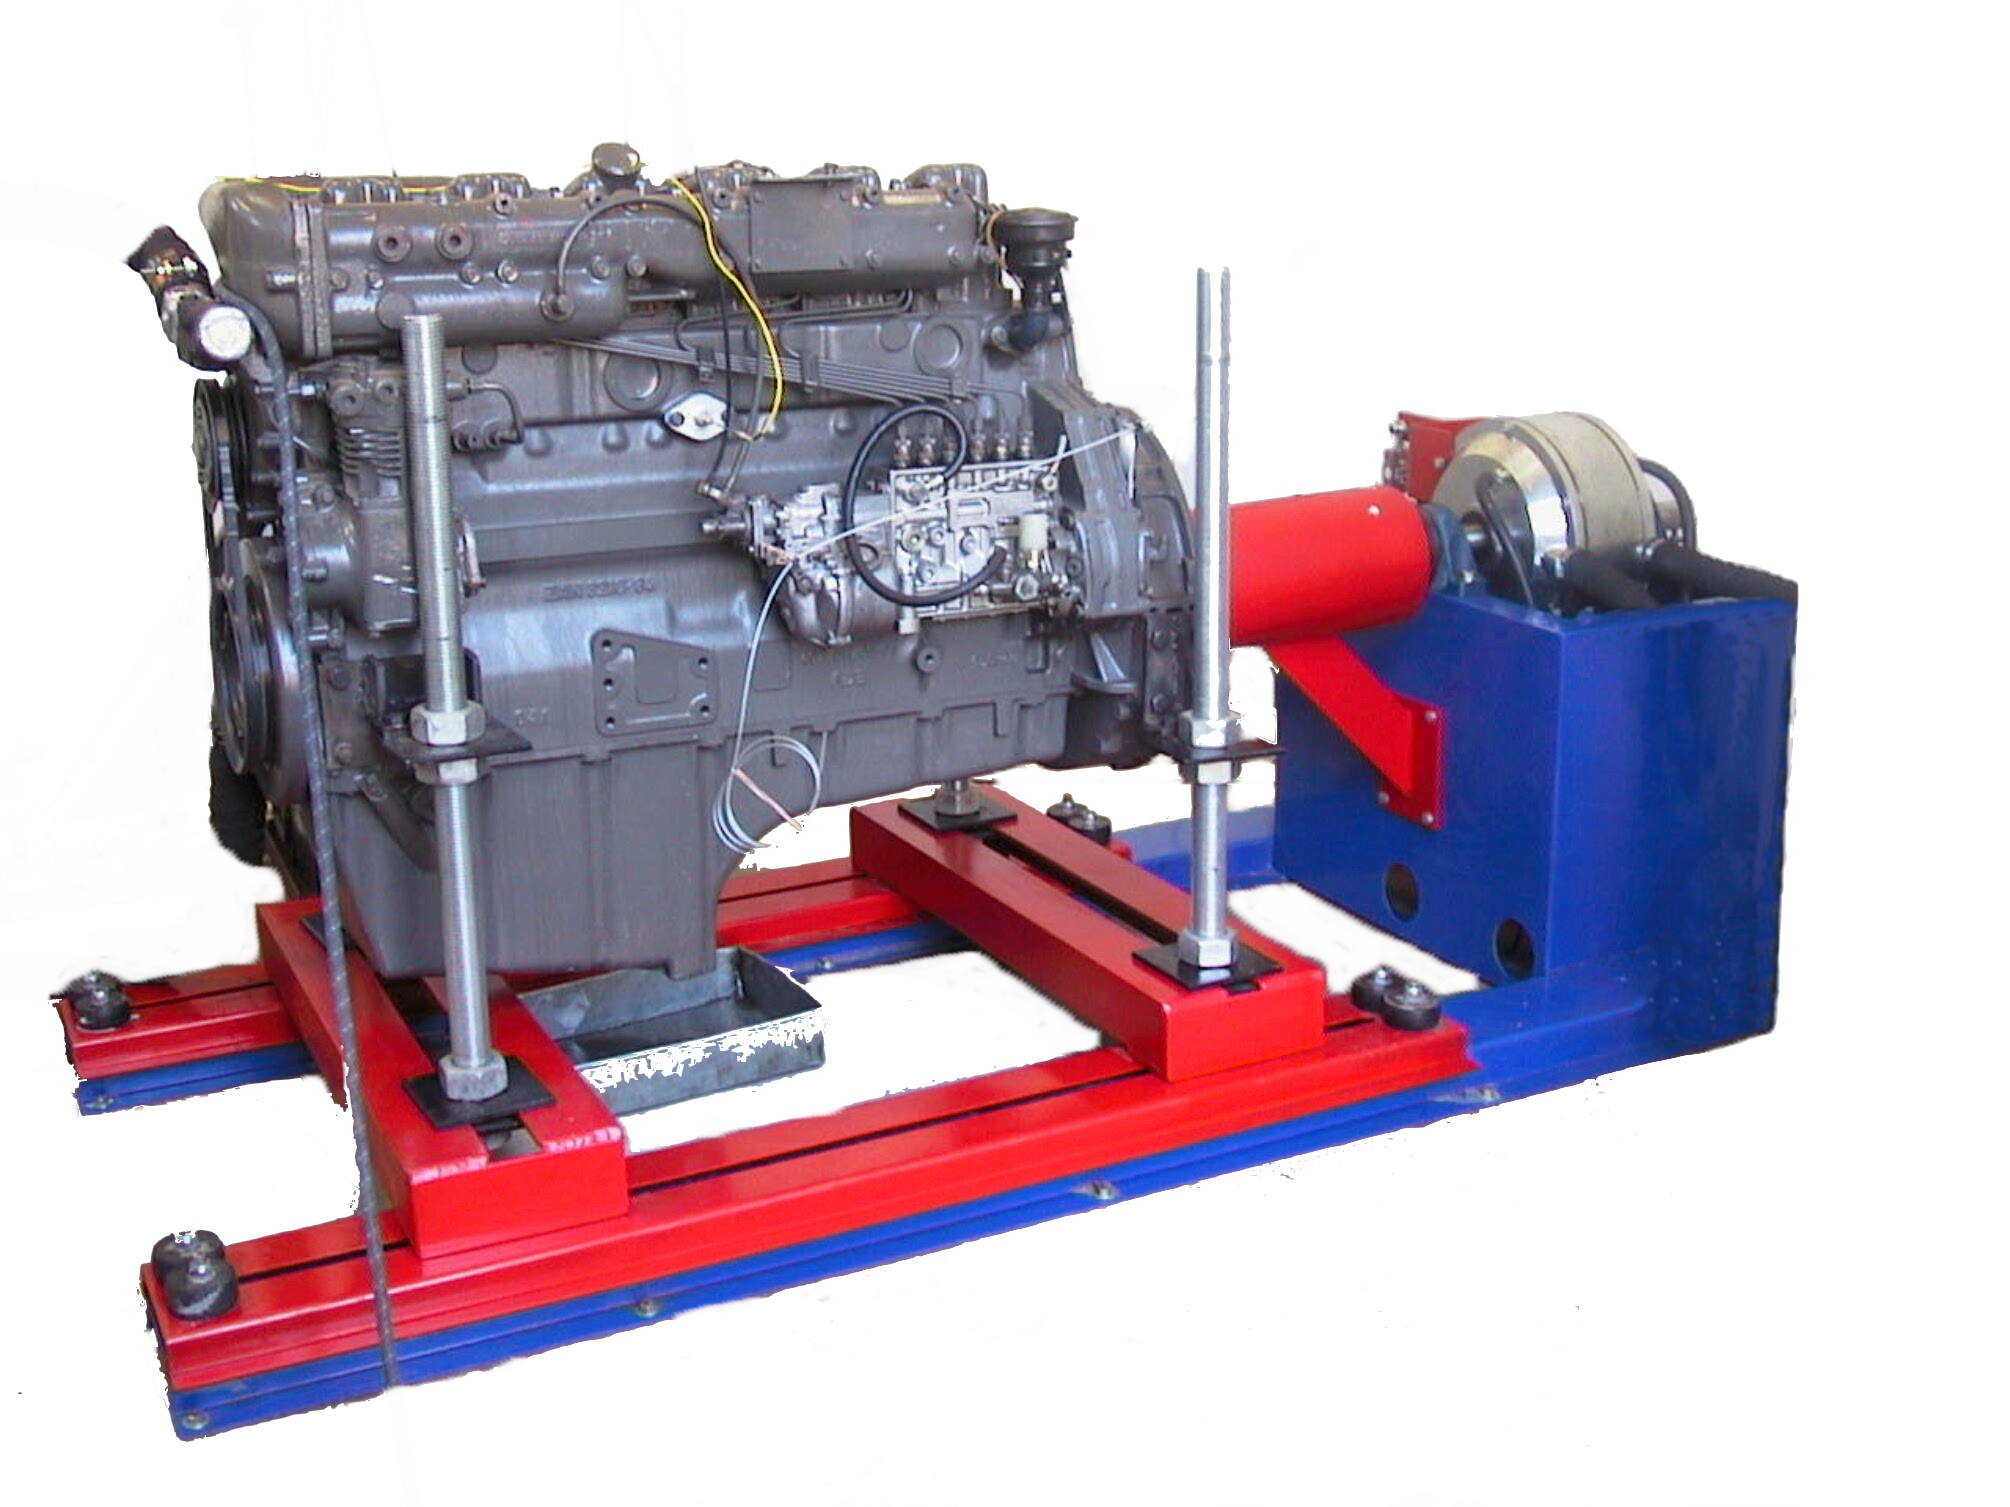
The dyno interprets wheel speed and force through the transmission path. Shorter gears multiply torque at the wheels, affecting calculated power figures. Engine dynos provide more accurate measurements than chassis dynos because they eliminate transmission variables from the testing equation. Our precision testing services ensure operators have the tools necessary to conduct reliable performance assessments across different vehicle configurations.
Operators must establish consistent gearing for valid baseline comparisons, ensuring accurate before-and-after analysis of true engine performance rather than transmission effects.
Determine Horsepower From Acceleration Rate
Once operators comprehend how gear ratios distort dyno readings, they can move forward to extract true engine performance data by calculating horsepower directly from acceleration measurements.
The horsepower calculation process begins with Newton’s Second Law, establishing that force equals mass multiplied by acceleration. A 900-kilogram vehicle accelerating from 5 m/s to 35 m/s over 20 seconds demonstrates an acceleration of 1.5 m/s², producing 1,350 Newtons of force.
Power emerges from multiplying force by final velocity. At 35 m/s, this yields 47,250 watts, which converts to approximately 63 horsepower using the standard divisor of 746. This power-to-velocity relationship demonstrates why instantaneous power measurements during acceleration provide more accurate engine output data than steady-state dyno testing alone. Real-time data collection during these acceleration phases ensures operators capture precise performance metrics for comprehensive analysis.
Understanding acceleration impact enables dyno operators to isolate engine performance from transmission losses, providing repeatable measurements essential for tuning decisions and performance benchmarking.
Account for Total Inertial Load on Test Results
Precision in dynamometer testing hinges on accounting for every rotating mass that consumes engine power during acceleration, a critical distinction that separates accurate performance data from misleading readings.
During inertial calculations, operators must recognise that engine power serves two purposes simultaneously: overcoming resistance and accelerating components. The WinDyn software automates inertia power calculations for SuperFlow dynamometers, eliminating manual computation errors that could compromise test validity. Proper system calibration during installation establishes the foundation for these precise calculations throughout the dynamometer’s operational life.
Understanding this relationship guarantees dyno design delivers trustworthy results:
- Power consumption during acceleration represents unmeasured work that must be added to load cell measurements
- Steady state versus sweep testing produces different readings because steady state ignores continuous acceleration power
- Acceleration rate dependency requires known rates combined with inertia values to calculate torque consumption
- Drivetrain loss variables including gear selection and fluid temperatures interact with inertial effects
Professional operators who excel in these distinctions join a community committed to extracting genuine performance observations from every test run.