Data logging and advanced analysis are crucial components of inertia dynamometer testing, enabling engineers to collect and process vast amounts of data from diverse sensors and channels, providing an in-depth understanding of engine performance.
Data logging involves collecting and storing data from multiple sensors, including RPM, torque, power, and speed, with sampling rates ranging from 100 to 1000 Hz or more, depending on the desired level of detail.
Advanced analysis features, such as filtering and history log, enable users to gain detailed insights into their test data.
These capabilities bring the complexities of engine performance into sharper focus, revealing opportunities for optimisation and refinement.
As a result, engineers can refine their designs and improve overall engine performance, leading to enhanced efficiency and productivity.
Data Logging Fundamentals
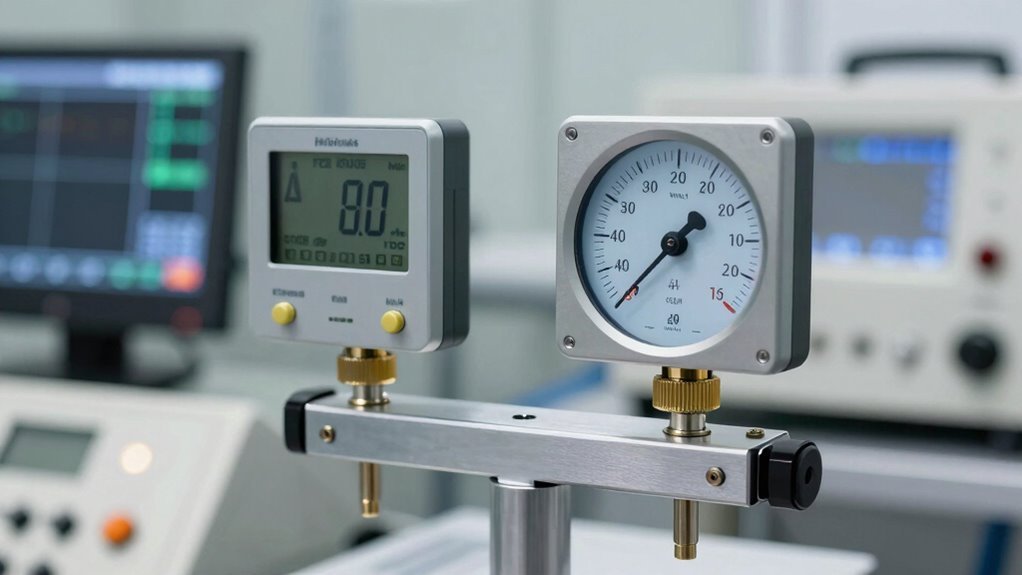
Data acquisition systems, a critical component of inertia dynamometers, are designed to record and store data from diverse sensors and channels, providing a thorough picture of engine performance.
Data logging, a fundamental aspect of data acquisition, involves collecting and storing data from multiple sensors, including RPM, torque, power, and speed.
The frequency of data logging depends on the application, with sampling rates ranging from 100 to 1000 Hz or more, depending on the desired level of detail and the type of analysis to be performed.
Data loggers store data in multiple formats, including CSV, ASCII, and binary files, which can be imported into analysis software for further processing and visualization.
Real-time data monitoring enables engineers to observe engine performance in real-time, allowing swift identification of issues and optimisation of engine performance.
The quality and accuracy of the data logging system are critical, as they directly impact the reliability and validity of the test results and subsequent analysis.
Engineers can perform meaningful data analysis, leading to informed decisions and improved engine performance, when accurate and reliable data are captured.
Advanced Analysis Features
As dynamometer data volume and complexity increase, advanced analysis features become essential for extracting valuable insights and maximising engine performance.
The DataMite III USB data logger offers a range of advanced features that enable users to gain detailed insights into their test data. Filtering and history log features allow users to scrutinise their dynamometer data, while the Analyzer software facilitates customisation of printed reports and graphs, enabling users to present data according to their specific needs.
The Enterprise Edition software takes analysis to a higher level, providing real-time power curve comparison and six gauges on the right side of the screen, giving users a comprehensive view of their dynamometer data.
Additionally, the software's ASCII file export feature enables users to import data into other programmes for further analysis and manipulation.
The DataMite III USB's 3-axis accelerometer and GPS features provide accurate track maps and lap timing for road racing and circle track systems, allowing for advanced analysis of vehicle performance.
Real-Time Data Visualization
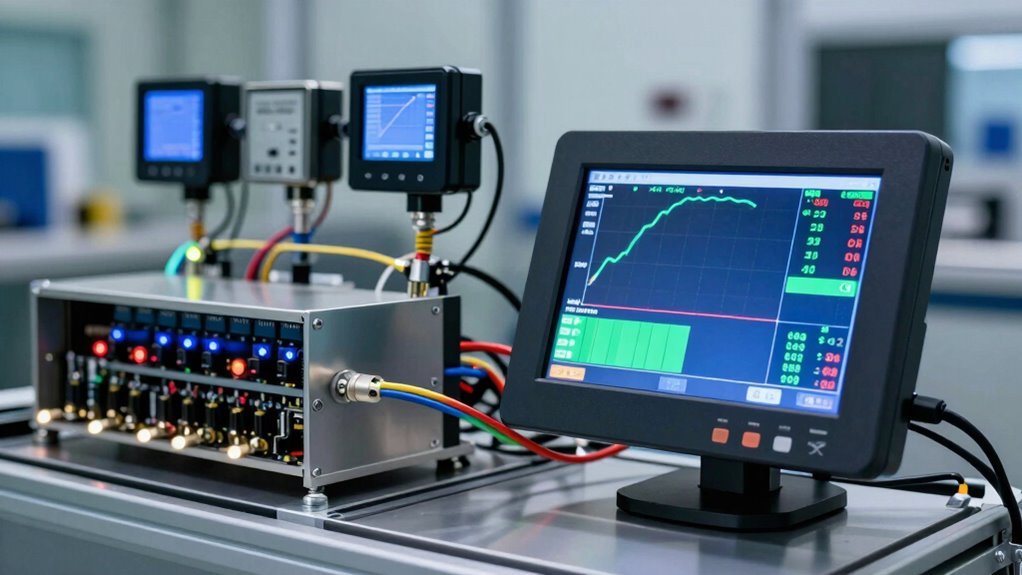
Real-time data visualization is a critical component of dynamometer software, enabling users to monitor engine performance in real-time through advanced graphing options, power curve visualization, and live data streaming.
These features allow users to identify trends, anomalies, and irregularities as they occur, facilitating prompt corrections and optimizing engine performance.
Real-Time Graphing Options
Within the sphere of engine performance analysis, the ability to visualize data in real-time is crucial for identifying trends, anomalies, and areas for improvement.
Performance Trends' real-time graphing options enable users to visualize and analyse engine performance data in real-time, including torque, power, and RPM.
The software's real-time data visualization tools allow users to monitor engine performance trends and identify any irregularities for immediate corrections.
Customizable graphing options enable users to create personalized dashboards with specific data channels, such as fuel flow, airflow, or oil pressure, to focus on key performance indicators.
Real-time graphing options can be used in conjunction with the software's data logging capabilities to create an exhaustive testing and analysis system.
Furthermore, the software's real-time graphing options support multiple channel plotting, allowing users to compare and contrast different data channels simultaneously.
With DataMite, a high-performance data logger, and the dyno system, users can experience seamless real-time graphing, providing an in-depth appreciation of engine performance across the RPM range.
Power Curve Visualization
Building upon real-time graphing capabilities, Performance Trends' software elevates data visualization with its Power Curve Visualization feature.
This feature enables real-time data visualization of an engine's power output, allowing users to monitor and adjust engine performance during testing sessions. Real-time power curve visualization provides immediate insights into vital engine parameters such as torque, power, and RPM, enabling users to make informed adjustments and optimize performance during testing sessions.
The software's advanced data analysis capabilities enable users to overlay multiple power curves for comparison and generate custom reports for detailed analysis, facilitating the identification of trends and areas for improvement.
Customizable power curve visualization settings, including axis scaling, data filtering, and curve smoothing, allow users to tailor the visualization experience to specific testing needs and preferences. With real-time power curve visualization, users can quickly identify anomalies or irregularities in engine performance, allowing for prompt adjustments and minimizing the risk of engine damage or premature wear.
This feature is particularly useful for dyno testing, where precise data analysis is vital for optimizing engine performance.
Live Data Streaming
Complementing its power curve visualization capabilities, Performance Trends' software takes data analysis to the next level with its Live Data Streaming feature, offering unparalleled real-time data visualization for inertia dynamometers.
This feature is made possible through the DataMite III USB and DataMite 4, which provide live data streaming capabilities.
The Enterprise Edition software enables real-time power curve comparison, allowing users to visualize and compare power curves as they are generated.
Real-time data visualization enables users to monitor engine performance trends and identify irregularities immediately, making it possible to make adjustments during testing sessions.
The software's live data streaming feature supports up to 40 channels of data logging, providing users with an exhaustive view of engine performance in real-time.
Users can customize the live data streaming feature to display specific channels and parameters, tailoring the visualization to their specific testing needs.
This level of real-time insight enables users to optimize engine performance and make data-driven decisions with confidence.
Customizable Report Generation
Customizable report generation in Performance Trends' software offers a range of data customization options, allowing users to tailor reports to specific testing requirements.
Report template design flexibility enables the creation of bespoke reports that effectively communicate test results, with options to overlay graphical data for improved understanding.
Data Customization Options
Three key aspects of Performance Trends' software enable users to tailor their data analysis and presentation to specific needs: customised report generation, selective data filtering, and versatile data export options.
This flexibility is vital in inertia dynamometer testing, where precise and targeted data analysis is necessary. Customised reports allow users to create tailored documents that meet specific testing requirements, making it easier to share results with stakeholders or engine manufacturers.
The software also provides the option to create printed reports and ASCII files, offering further flexibility in data analysis and presentation.
The filtering feature enables users to selectively display specific data points or ranges, streamlining the analysis process and highlighting critical performance trends.
Real-time power curve comparison, a feature available in the Enterprise Edition software, allows users to instantly assess engine performance and make informed adjustments during testing sessions.
This enables users to efficiently analyse and present their data, ultimately driving more informed decision-making and improved engine performance.
Report Template Design
Designing report templates with Performance Trends' software enables users to tailor the layout and content of their inertia dynamometer reports to suit specific testing needs and preferences.
This feature allows users to create bespoke reports that effectively communicate test results and insights.
Users can customise reports to:
- add or remove data columns and tailor graph layouts to focus on key test metrics
- incorporate company logos or branding for professional-looking reports
- save custom report templates for future use, streamlining the reporting process and reducing the time spent on data analysis and presentation
The software's advanced analysis capabilities enable users to generate detailed reports that include statistical analysis, data summaries, and visual representations of test data.
Customised report templates can be exported in different formats, including PDF, CSV, and Excel, making it easy to share test results with colleagues, clients, or manufacturers.
Users can create thorough and informative reports that support data-driven decision making using Performance Trends' software.
Graphical Data Overlay
We can elevate our reporting capabilities with graphical data overlay, a feature that enables the creation of highly customizable reports.
This feature allows us to combine data from diverse measurement devices, including torque measurement tools, into a single, thorough report. Graphical data overlay enables visualization of complex relationships between different data sets, providing a deeper insight into the testing process.
Users can import data from Track Analyzer v3.5/v and Analyzer Pro v3.9 New, as well as DataMite Data, to create detailed reports that meet specific needs.
For instance, engineers can overlay lap time data with torque measurement data to analyze a vehicle's performance during a test session. This level of customization enables creation of reports tailored to specific requirements, making it easier to identify trends, patterns, and areas for improvement.
Graphical data overlay provides new perspectives, allowing users to make data-driven decisions with confidence.
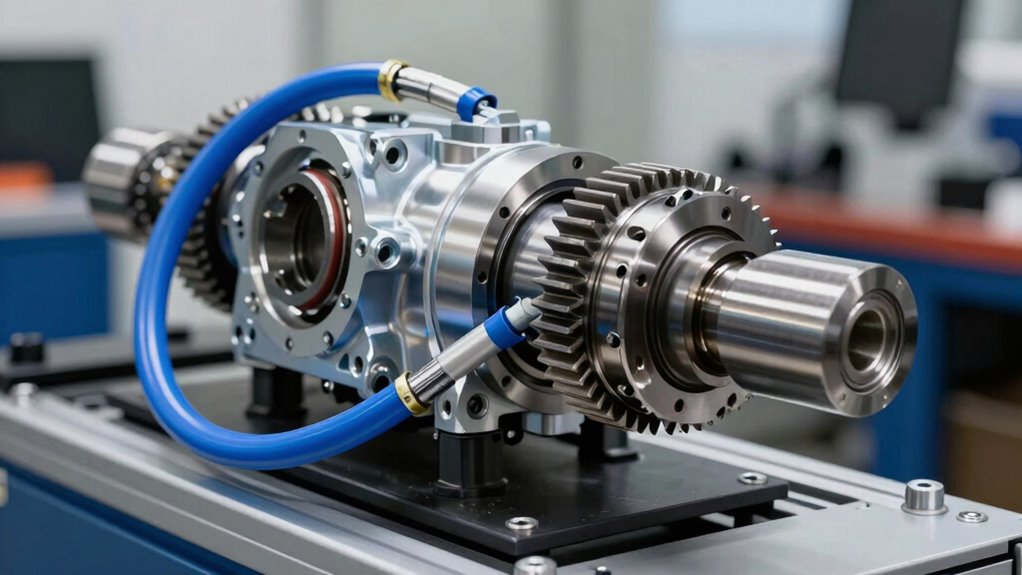
Integrating Additional Sensors
Up to twelve additional sensors can be seamlessly integrated into the DataMite III USB data logger, greatly expanding its analytical capabilities.
This allows users to gather more thorough data on engine performance, providing a more in-depth grasp of how the engine operates under different conditions.
The DataMite III USB's 12 analogue channels enable the connection of multiple sensors, including fuel flow, airflow, oil or fuel pressure, and A/F ratio sensors.
These sensors provide valuable insights into engine performance, allowing users to utilise the GPS feature to obtain accurate track maps and lap timing for road racing and circle track systems.
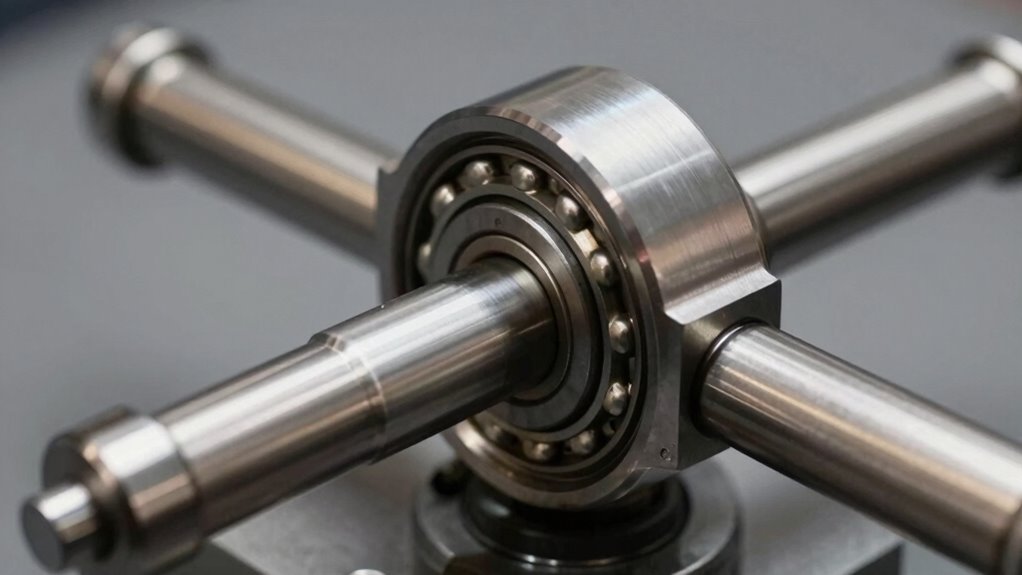
The 3-axis accelerometer measures vibrations, shock, and other dynamic forces, identifying potential issues with the engine or dynamometer.
Integration of sensors enables analysis of data from multiple sources, identifying trends or patterns that may indicate areas for refinement or optimisation.
Optimizing Data Acquisition
Twelve channels of data acquisition provide a sturdy foundation for optimizing engine performance, enabling the simultaneous monitoring of multiple parameters, including RPM sensors, torque and speed, and load cell outputs.
The DataMite data acquisition system can be utilised to boost the data acquisition process, seamlessly integrating with the Analyzer Plus software to allow for real-time data monitoring and analysis.
This advanced technology enables engineers to accurately capture and analyse test conditions, identifying areas for improvement and optimising engine performance.
The Computer Software enables users to configure the data acquisition system to meet specific testing requirements, allowing for the creation of customised test profiles that ensure critical data is captured during each test cycle.
The software provides advanced data analysis tools, enabling users to extract valuable insights from the acquired data.
Optimising data acquisition enables engineers to gain a deeper insight into engine behaviour, leading to improved performance, increased efficiency, and reduced development time.
Advanced Filtering and History Log
Accurate data analysis relies on the ability to effectively filter out noise and irrelevant data, ensuring that only relevant information is extracted from the vast amounts of data acquired.
Advanced filtering and history log capabilities are crucial in achieving this goal.
Users can refine their data to focus on specific parameters, such as speed, torque, or temperature, using advanced filtering.
This enables the isolation of specific events or trends, allowing for more accurate data analysis.
Some key features of advanced filtering and history log include DataMite's Pro v3.9 New Features, which enable advanced filtering and data processing capabilities, and Flow Analyzer v3.5 B, a diagnostic tool that provides detailed insights into system performance.
Historical data logging also allows users to access and analyze data from previous tests, enabling the identification of trends and patterns over time.
Conclusion
Data Logging and Advanced Analysis for Inertia Dynamometers
Data Logging Fundamentals
At Hyper Power, we understand the importance of data logging in inertia dynamometer testing, which provides an exhaustive record of test data for analysis and evaluation. Our modern data logging systems enable the capture of high-speed, high-resolution data, allowing for detailed insight into the performance of the test article. Key data logging fundamentals include sampling rate, resolution, and data storage capacity. If you have any questions about our Custom Dyno Solutions, please do not hesitate to contact us.
Advanced Analysis Features
Our advanced analysis features enable the extraction of valuable insights from logged data. These features include frequency analysis, statistical process control, and data filtering. Frequency analysis enables the identification of specific frequency components, while statistical process control makes it possible to detect trends and anomalies. Data filtering allows for the removal of noise and unwanted signals. For more information on how our Installation and Setup services can help you get started, contact Hyper Power.
Real-Time Data Visualization
Real-time data visualization enables the instantaneous display of test data, allowing for prompt identification of issues and optimisation of test parameters. This feature is particularly useful in dynamic testing, where rapid changes in test conditions can occur. Our Training and Certification programmes can help you get the most out of this feature.
Customisable Report Generation
Customisable report generation allows users to create tailored reports, incorporating specific data and analysis results. This feature streamlines the reporting process, reducing the time and effort required to generate thorough test reports. For assistance with creating custom reports, please contact Hyper Power for Technical Support and Maintenance.
Integrating Additional Sensors
The integration of additional sensors, such as temperature, pressure, or vibration sensors, provides a more thorough grasp of test article performance. This integration enables the correlation of multiple data streams, making it possible for a more detailed analysis of test results. Our Diagnostics and Performance Analysis services can help you optimise sensor integration.
Optimising Data Acquisition
Optimising data acquisition involves the careful selection of sampling rates, trigger modes, and data storage parameters. This optimisation guarantees that the required data is captured efficiently, minimising data storage requirements and reducing the risk of data loss. Our Rental Services can provide you with the necessary equipment to optimise your data acquisition.
Advanced Filtering and History Log
Advanced filtering and history log features enable the efficient management of large datasets, making it possible for the removal of unwanted data and the identification of specific events or trends. For more information on how our Software Updates and Upgrades can enhance your data management capabilities, contact Hyper Power.
Conclusion
The integration of advanced data logging and analysis capabilities in inertia dynamometers enables the acquisition of high-quality test data and makes it possible for the extraction of valuable insights. By leveraging these capabilities, users can optimise test parameters, improve test efficiency, and gain a deeper grasp of test article performance. If you have any questions about how Hyper Power can help you with your inertia dynamometer testing, please do not hesitate to contact us for Dynamometer Testing Services or Accessories and Parts.