Accurate interpretation and analysis of inertia dynamometer test results are crucial for evaluating the performance of internal combustion engines, electric motors, and other rotating machinery.
Graph shapes and trends provide valuable insights into machine behaviour, allowing identification of areas for refinement and optimisation.
Relationships between power, torque, and acceleration should be examined to gain insight into machine performance.
Effective analysis enables optimisation of machine performance, reduction of energy consumption, and improvement of overall efficiency. Engineers can uncover opportunities for improvement and unlock the full potential of their machines, revealing the secrets hidden in the data, through a thorough understanding of inertia dynamometer tests and result interpretation.
Understanding Inertia Dynamometer Tests
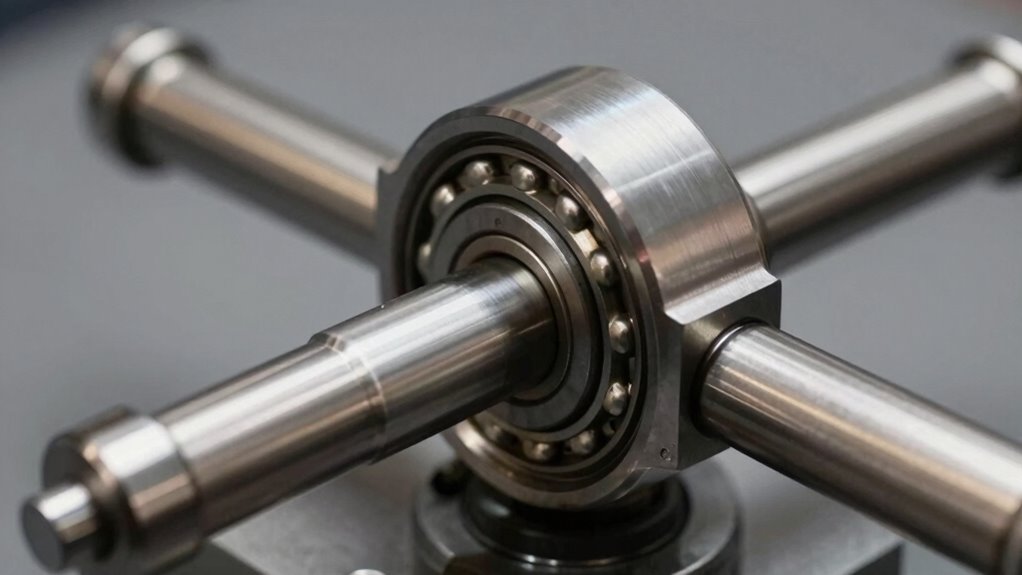
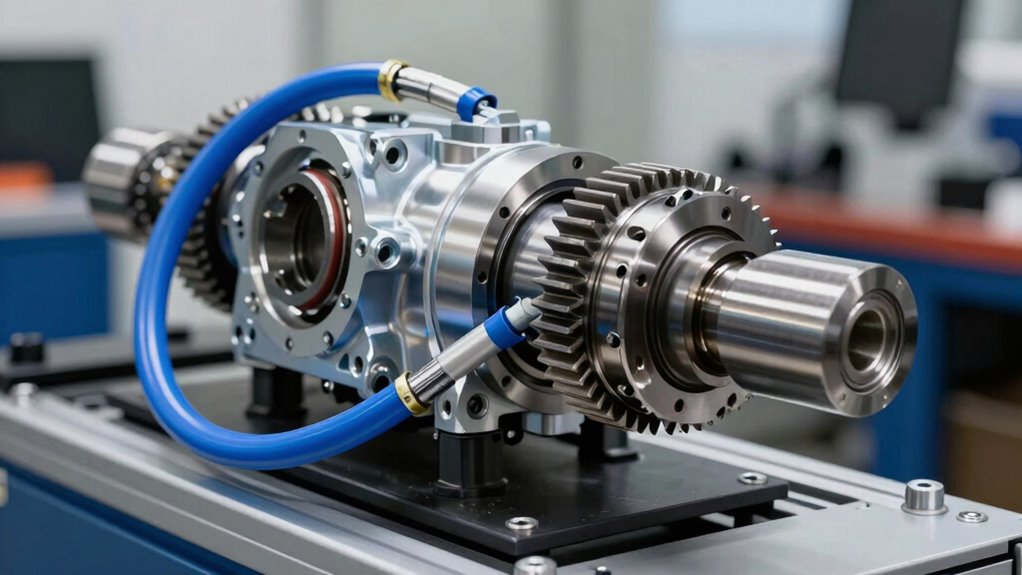
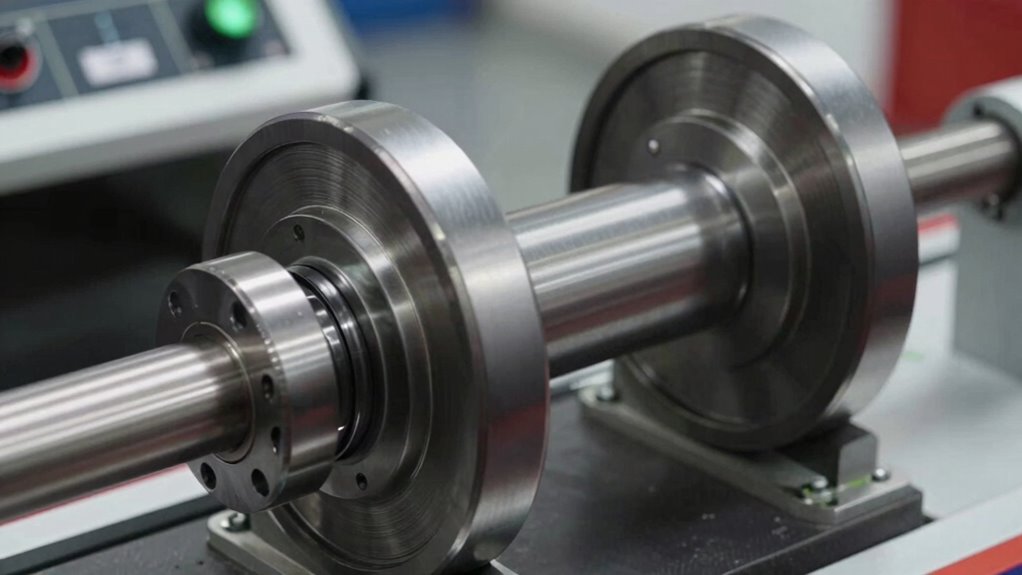
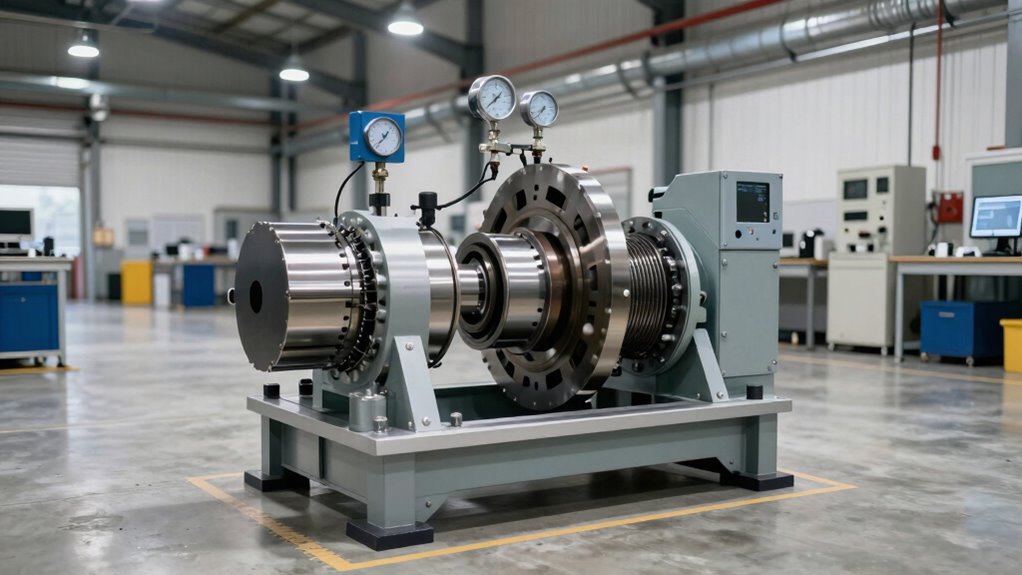
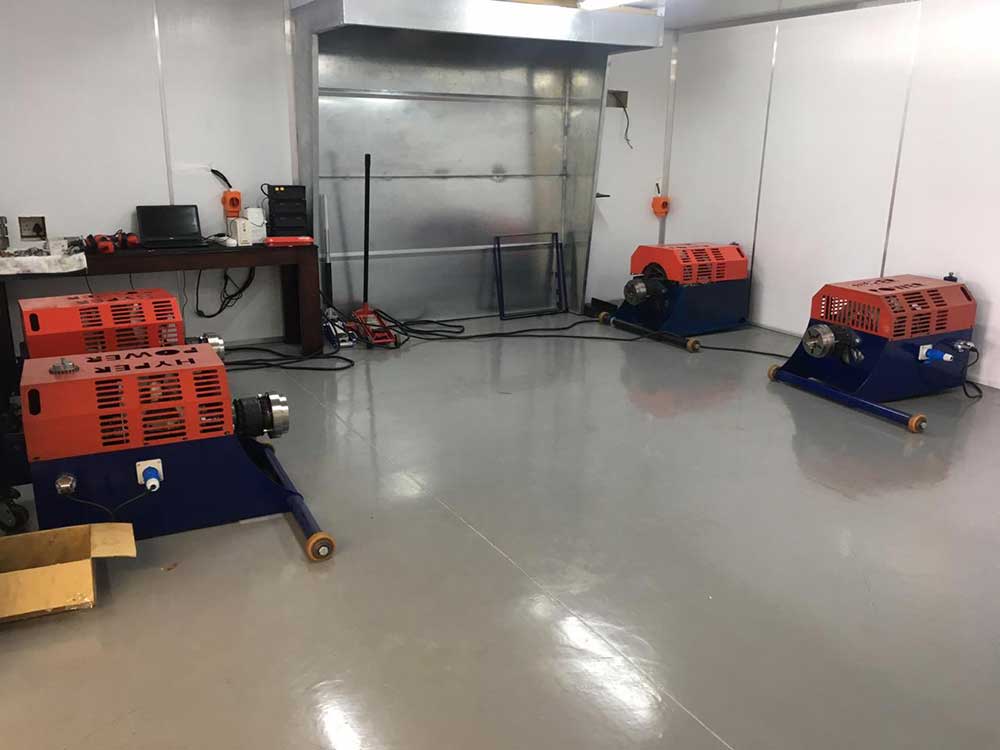
The test bench setup of an inertia dynamometer is a crucial aspect of evaluating the performance of internal combustion engines, electric motors, and other rotating machinery.
This setup enables engineers to accurately measure the rotational speed and torque output of these machines, providing valuable insights into their efficiency and reliability. The inertia dyno test involves attaching the machine to the dynamometer, which applies a variable load to the machine's output shaft, resulting in inertia values that are essential in understanding the machine's performance under different operating conditions.
The dynamometer absorbs the energy generated by the machine, allowing for precise measurement of its power output. The load applied simulates real-world operating conditions, enabling engineers to evaluate the machine's performance in diverse scenarios.
Analysis of the test results enables engineers to identify areas for improvement, optimise machine design, and guarantee compliance with industry standards. Grasping the principles of inertia dynamometer tests enables engineers to tap the full potential of their machines, driving innovation and progress in their respective fields.
Interpreting Graph Shapes and Trends
Performance optimisation hinges on the ability to decipher the intricate language of graph shapes and trends, which serve as a window into the inner workings of the machine under test.
These visual representations of data provide valuable insights into the machine's behaviour, allowing engineers to identify areas for improvement and optimise performance.
When analysing graph shapes and trends, engineers should pay attention to the relationships between power, torque, and acceleration.
For instance, a graph may show a gradual increase in power output as torque increases, indicating a well-functioning machine. Conversely, an abrupt drop in power may signal a mechanical issue.
Acceleration patterns can also reveal valuable information, such as uneven torque application or inefficient energy transfer.
Dynamometers, the devices used to measure these parameters, provide accurate and reliable data.
Graph analysis is vital in identifying performance bottlenecks and making targeted improvements.
Effective analysis enables engineers to optimise machine performance, reduce energy consumption, and enhance comprehensive efficiency.
Low-End Power Analysis and Optimization
As an engine's power delivery in daily driving and city traffic conditions is largely dictated by its low-end power capabilities, analysing this critical range is crucial for optimising total drivability.
The low-end power analysis on an inertial dyno test result focuses on the engine's power delivery between 1,500 to 3,000 RPM. A well-optimised low-end power curve can improve acceleration, responsiveness, and general drivability, making the vehicle feel more agile and responsive to driver input.
Inertia dynamometer test results reveal whether an engine's low-end power is hindered by restrictive airflow, inefficient camshaft profiles, or inadequate fuel injection, allowing for targeted modifications to address these limitations.
Engine tuners can identify opportunities to improve torque output, fundamental for towing, hauling, or driving uphill, through modifications such as camshaft upgrades, intake manifold design changes, or exhaust system improvements. Optimising low-end power can also lead to improved fuel efficiency, as the engine can operate more efficiently at lower engine speed ranges, resulting in better gas mileage and reduced emissions.
Mid-Range Power Performance Evaluation
Mid-range power performance evaluation is crucial as it indicates an engine's ability to produce power in the most frequently used RPM range, typically between 3,000 to 5,000 RPM.
This range substantially impacts an engine's general drivability and performance. On an inertia dynamometer, mid-range power performance evaluation is vital as it identifies if an engine produces the desired power output, essential for everyday driving, towing, or hauling heavy loads.
When evaluating mid-range power performance, the following key aspects are vital to consider:
- Power output: A well-designed engine should produce a smooth, linear power curve in the mid-range, indicating efficient combustion and minimal energy losses.
- Power curve shape: A dip or sag in the mid-range power curve may indicate issues such as intake manifold restrictions, ignition system weaknesses, or camshaft design limitations.
- Targeted modifications: Mid-range power performance evaluation enables engine tuners and technicians to make targeted modifications to improve power delivery, resulting in improved general engine performance and drivability.
Top-End Power Improvement Strategies
Optimizing engine components for high-RPM power gains is vital for achieving top-end performance.
By focusing on airflow and reducing restriction, engine builders can unleash significant increases in power output.
Through the strategic implementation of diverse techniques, including component upgrades and calibration adjustments, engineers can successfully improve high-RPM power and engine inertia.
High-RPM Power Gains
An engine's ability to produce power at high RPM ranges is critical for achieving exceptional acceleration and total performance.
To release the full potential of an engine, it is vital to focus on top-end power improvement strategies.
Optimising engine components such as camshaft, cylinder head, and intake manifold design to amplify airflow and efficiency at high RPM ranges is a pivotal step.
This leads to significant gains in horsepower and torque, resulting in improved acceleration and performance.
Increasing compression ratio, using high-octane fuel, and optimising ignition timing contribute to substantial top-end power gains, especially in naturally aspirated engines.
In turbocharged or supercharged engines, improving compressor wheel design, turbine design, and waste gate control helps to increase surge pressure and airflow at high RPM, resulting in substantial top-end power gains.
Optimizing Engine Inertia
As engine speed increases, accurate engine inertia values become crucial, as even slight discrepancies can lead to vital errors in power measurement and loss calculation.
Inertia calibration experiments, such as the three-wire pendulum experiment, can precisely measure vehicle wheel inertia to optimise engine performance. To verify accurate calculation of engine inertia, values must be multiplied by the speed ratio squared if rotating at different speeds.
Accurate engine inertia values are essential for top-end power improvement, as incorrect values can result in a 6 per cent error in power measurement and a 9 per cent error in loss calculation.
Inertia disconnection on loss calculation results in a 6 per cent error, highlighting the necessity of accurate inertia values for top-end power improvement. When analysing test results on engine dynos, it is imperative to examine inertia values to optimise engine performance.
Inertia information can profoundly affect measurement accuracy, ultimately impacting the power produced and peak torque. Accurate measurement and accounting for engine inertia can optimise engine performance, leading to improved top-end power gains.
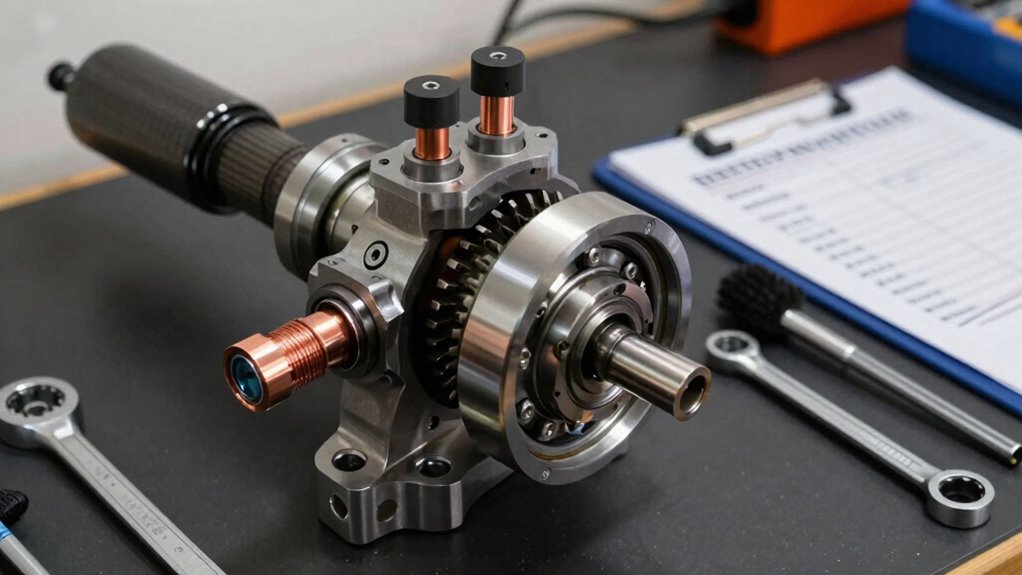
Inertia Calibration Methods and Tools
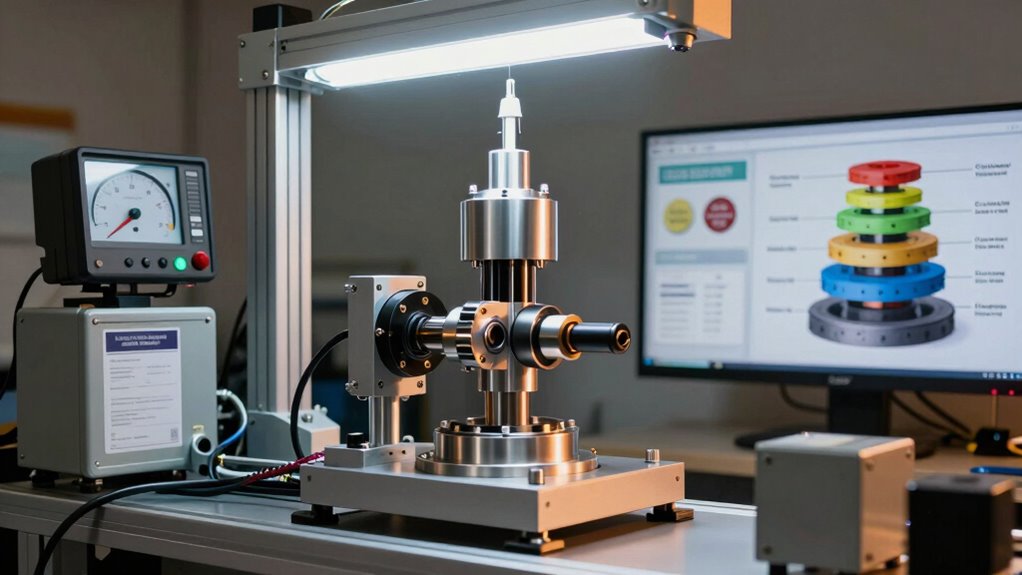
Inertia calibration is a vital aspect of dynamometer testing, and diverse tools and methods are employed to verify accurate results.
Among these, reading inertia values from the dyno CAD model and utilizing Dyno2 software tools for interactive adjustment of inertia entries are prominent approaches.
Furthermore, specialized calibration tools, such as those leveraging physics experiments, are also employed to certify precise inertia measurements.
Inertia Calibration Tools
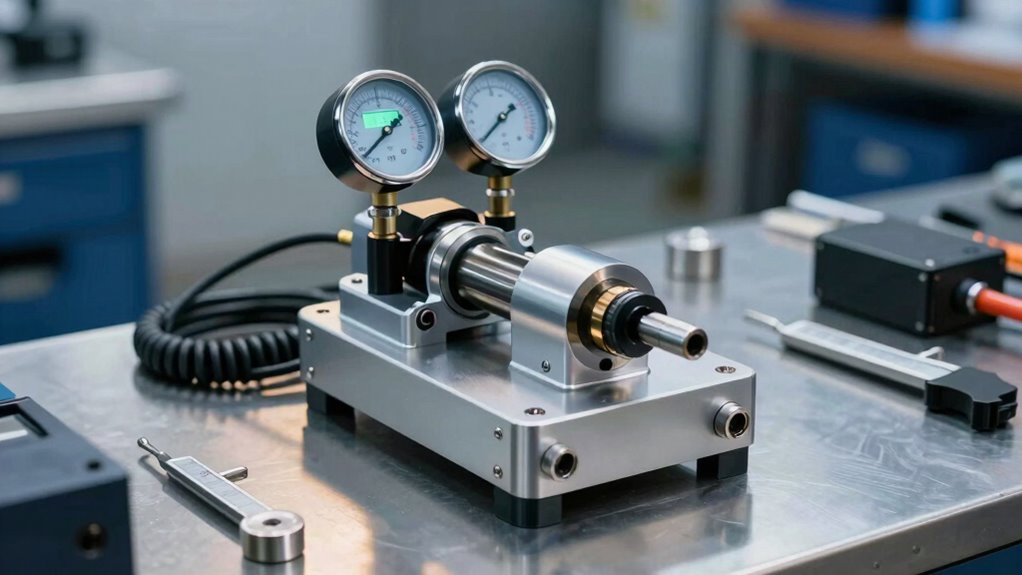
Calibration tools play a pivotal role in ensuring the accuracy of inertia dynamometer testing, and several methods have been developed to measure vehicle wheel inertia with varying degrees of precision and complexity.
Inertia calibration tools can be categorised into several types, including:
- Falling mass inertia calibration tool: This simple experiment measures dyno inertia by dropping a known mass onto the dyno roller.
- Three-wire pendulum experiment: This precise method measures vehicle wheel inertia by measuring the oscillation period of the pendulum.
- Hard braking inertia calibration tool: This tool estimates inertia by braking with full power while measuring torque and deceleration.
Accurate inertia dynamometer testing relies on these tools, which provide a means to measure and calibrate the dyno's load cell and dyno roller.
Brake dynos, in particular, require accurate inertia calibration to provide reliable test results.
Engineers can confidently analyse and interpret inertia dynamometer test results, gaining valuable insights into vehicle performance and behaviour, through utilisation of these inertia calibration tools.
Read From Dyno CAD
One innovative approach to inertia calibration involves reading inertia from a dyno CAD model. This method utilises computer-aided design software to calculate the inertia value of a vehicle or component.
It is particularly useful for estimating inertia values when physical measurements are not possible or are impractical. Dyno CAD models can provide accurate inertia values, taking into account the mass distribution and geometry of the vehicle or component.
This approach is especially valuable for complex systems or custom components where empirical data is not available.
The calculated inertia value can then be used to calibrate the dynamometer, ensuring accurate test results.
Engineers can overcome the challenges of measuring inertia in complex systems through the use of dyno CAD models. This method enables precise calculation of inertia values, which is vital for reliable dynamometer test results.
Incorporating dyno CAD models into the inertia calibration process streamlines workflow and achieves more accurate results.
This innovative approach has the potential to revolutionise the way inertia calibration is approached, providing a more efficient and effective means of ensuring accurate test results.
Calibrate With Dyno2
Dyno2, a cutting-edge tool, offers a thorough approach to inertia calibration, providing engineers with a sturdy method to guarantee accurate test results.
This advanced calibration method verifies that dynos, including hub dynos, are precisely calibrated, allowing for reliable and consistent test data.
Dyno2 enables engineers to eliminate human error as automation of the calibration process minimises the risk of human mistake, certifying that results are accurate and trustworthy.
The advanced algorithms and sensors of Dyno2 provide precise measurements, allowing for a more accurate calibration of the inertia dynamometer and increasing precision.
Furthermore, the calibration process is substantially faster with Dyno2, reducing downtime and increasing productivity in the testing process.
With Dyno2, engineers can have confidence in their test results, knowing that their dynos are calibrated to the highest standards.
This, in turn, enables them to make informed decisions and optimise their designs, leading to improved performance and efficiency.
Inertia Effects on Measurement Accuracy
Operating at high rotational speeds, inertia dynamometers introduce errors in measurement accuracy due to inertial forces acting on the system.
These forces cause the dynamometer to resist changes in rotational speed, affecting the measurement of torque and power output. When the dynamometer is asked to brake or accelerate, the system's inertia comes into play, causing a delay in the measurement response. This delay results in inaccurate measurements, particularly during rapid changes in load or speed.
The absorption of inertial forces by the dynamometer's mechanical components contributes to measurement errors.
As the dynamometer absorbs these forces, it leads to a lag in the measurement response, further compromising accuracy. It is crucial to take into account the dynamometer's inertia and its components when designing and conducting tests. Engineers can develop strategies to minimize errors and guarantee reliable test results if they grasp the inertia effects on measurement accuracy.
Dyno Settings and Inertia Considerations
During dynamometer testing, the accuracy of measurements largely depends on the settings used, particularly when considering the effects of inertia.
Inertia, being the tendency of an object to resist changes in its motion, can significantly influence test results if not properly accounted for.
Accurate measurements rely on carefully considering dyno settings and inertia considerations.
The following factors are crucial:
- Load control: Set the load control system to maintain a steady speed, allowing the dynamometer to accurately measure the engine's output.
- Inertia compensation: Adjust the dynamometer's inertia compensation setting to account for the test article's rotational inertia, ensuring measured values accurately reflect the engine's performance.
- Dynamometer calibration: Regularly calibrate the dynamometer to guarantee accurate and reliable measured values, taking into account any changes in the test environment or equipment.
Analyzing Test Results for Engine Performance
When analysing inertia dynamometer test results, it is crucial to consider the intricate relationship between measured power output and expected performance.
The engine being tested exhibits unique absorption characteristics, which are influenced by the inertia dynamometer's settings and calibration. Accurate analysis of test results requires consideration of the measured power output in relation to the expected performance, taking into account potential errors in power measurement.
Omitting car inertia on an inertial dyno can result in a 9% error in power measurement. Moreover, engine inertia disconnection on loss calculation can lead to a 6% error, highlighting the importance of precise inertia values in test results analysis.
To achieve accurate results, the equivalent mass inertia of the dyno roller must be calculated, and inertia calibration experiments, such as the three-wire pendulum experiment, can provide precise measurements of vehicle wheel inertia. Careful analysis of test results in the context of these factors enables accurate assessment of engine performance, providing valuable insights for engine optimisation and improvement.
Conclusion
Understanding Inertia Dynamometer Tests
Hyper Power provides customised solutions for evaluating engine performance, and inertia dynamometer testing is a crucial tool in this process. To fully utilise the data generated, it is essential to understand how to interpret and analyse the test results.
Interpreting Graph Shapes and Trends
Inertia dynamometer test results are typically presented in graphical form, with power and torque plotted against engine speed. The shape and trends of these graphs reveal crucial information about an engine's performance characteristics. For instance, a graph with a steep slope may indicate an engine with strong low-end power, while a graph with a plateau may suggest an engine with limited top-end power. If you have any questions about our Custom Dyno Solutions, please do not hesitate to contact us.
Low-End Power Analysis and Optimisation
Low-end power is critical for many applications, including daily driving and off-road use. By analysing the inertia dynamometer test results, our engineers can identify areas for improvement, such as optimising camshaft timing, fuel injection, and exhaust system design. This can lead to substantial gains in low-end power and responsiveness. Our Installation and Setup services can help you get the most out of your dynamometer testing.
Mid-Range Power Performance Evaluation
The mid-range power band is often the most vital for real-world driving scenarios. Inertia dynamometer test results can help our engineers evaluate an engine's mid-range power performance, identifying areas for improvement such as cylinder head design, piston design, and valve train optimisation. Our Technical Support and Maintenance team is always available to assist with any questions or concerns you may have.
Top-End Power Improvement Strategies
Top-end power is vital for high-performance applications, such as racing and high-speed driving. By analysing inertia dynamometer test results, our engineers can identify opportunities to improve top-end power, such as optimising engine compression ratio, camshaft design, and intake manifold design. Our Diagnostics and Performance Analysis services can help you identify areas for improvement in your engine's performance.
Inertia Calibration Methods and Tools
Accurate inertia calibration is vital for obtaining reliable test results. Diverse methods and tools are available, including manual calibration, automated calibration software, and specialised calibration equipment. Our engineers must choose the most suitable method for their specific application. We offer Training and Certification programs to ensure our clients are proficient in using our dynamometers.
Inertia Effects on Measurement Accuracy
Inertia can profoundly impact the accuracy of dynamometer test results. Our engineers must consider the effects of inertia on measurement accuracy, taking into account factors such as dynamometer type, test procedures, and data analysis techniques. Our Software Updates and Upgrades ensure that our clients have access to the latest tools and techniques.
Dyno Settings and Inertia Considerations
Dyno settings, such as load settings and inertia values, can profoundly impact test results. Our engineers must carefully consider these settings to guarantee accurate and reliable data. Inertia considerations, such as dynamometer inertia and load inertia, must also be taken into account. Our Rental Services provide clients with access to the latest dynamometers and equipment.
Analyzing Test Results for Engine Performance
Inertia dynamometer test results provide a wealth of information about an engine's performance. By analysing these results, our engineers can identify areas for improvement, optimise engine design, and develop more efficient and powerful engines. Our Dynamometer Testing Services can help you get the most out of your engine.
Conclusion
Accurate interpretation and analysis of inertia dynamometer test results are vital for evaluating engine performance and optimising design. By understanding graph shapes and trends, analysing low-end, mid-range, and top-end power, and considering inertia calibration, effects, and dyno settings, our engineers can tap the full potential of their engines. If you have any questions about our Accessories and Parts, please do not hesitate to contact Hyper Power.