EV Dyno Testing: The Ultimate High-Performance Guide
Most manufacturers get dyno testing wrong—and it’s costing them millions. Electric vehicle performance isn’t just about raw power numbers; it’s about choosing the right dyno type and execution method that actually reveals what your vehicle can do. Eddy current, water brake, or AC regenerative systems each tell radically different stories about your EV’s true capabilities. The difference between passing safety standards and achieving exceptional performance validation hinges on variables most teams overlook entirely. This guide exposes the testing strategies that separate mediocre results from breakthrough performance data.
What Dynos Measure: Power, Torque, Efficiency
The foundation of any dyno testing operation rests on three critical measurements: power output, torque delivery, and system efficiency.
Power measurement integrates torque and rotational speed data, with real-time energetic analysis via advanced DSP technology. Recent dyno technology advancements enable precise calculations from voltage and current readings, particularly in EV systems where power varies continuously. EPA testing methodology uses dynamometers to simulate driving conditions while the vehicle remains stationary, ensuring standardised performance evaluation across all electric vehicles. Our cutting-edge software solutions provide continuous monitoring and data analysis for optimal performance insights.
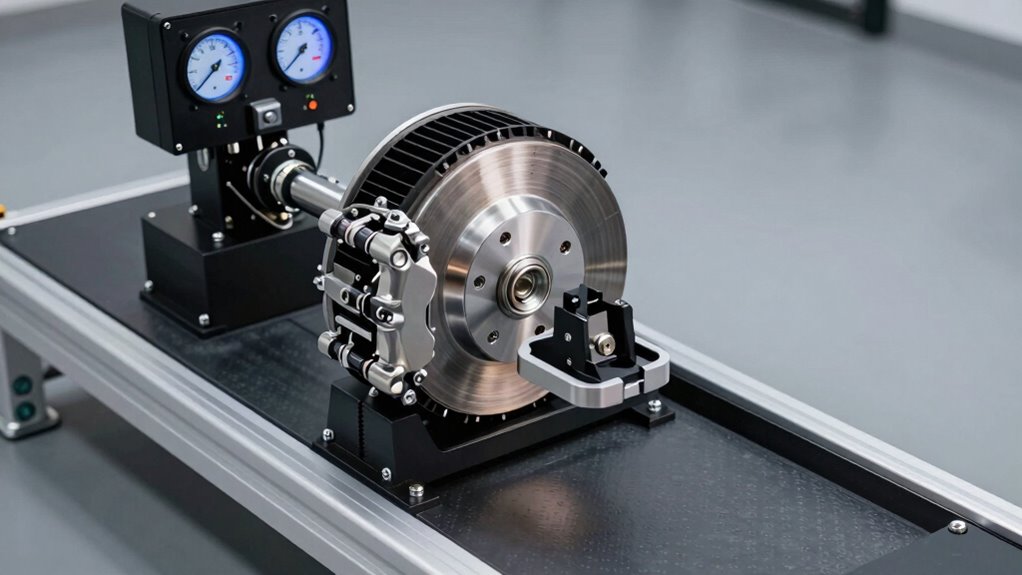
Torque measurement derives from dynamometer absorption brakes, with precision transducers capturing fluid pressures for accurate inference. Testing accuracy improvements now account for voltage fluctuations and frequency changes affecting EV torque output.
Efficiency evaluation combines temperature, noise, and vibration data within IEEE and IEC compliance standards. Regenerative systems return power to the mains, reducing energy consumption during high-power tests while enabling thorough system analysis that professionals trust.
Choose Your Dyno: Engine vs. Chassis vs. Roller Systems
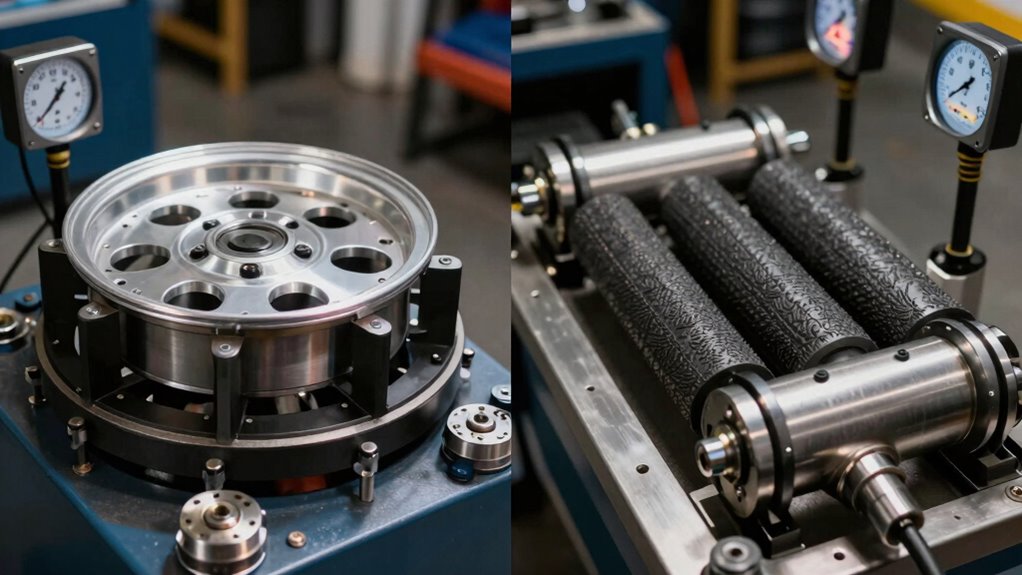
Because dyno selection fundamentally shapes testing capability and cost structure, understanding the differences between engine, chassis, and roller systems becomes essential for any operation pursuing precise performance data.
Engine dynos measure power directly at the motor shaft, eliminating drivetrain losses. Chassis dynos assess the complete vehicle, capturing real-world efficiency losses through transmissions and differentials. Roller dynamometers test at the wheels, providing thorough drivetrain assessment under conditions simulating actual road operation. Environmental factors such as temperature, airflow, and barometric pressure significantly impact chassis dyno accuracy and must be controlled during testing. State-of-the-art testing facilities ensure precise and insightful results through rigorous environmental management.
Engine dynos isolate motor performance, while chassis dynos reveal real-world efficiency losses through complete vehicle assessment at the wheels.
Dyno comparisons depend on testing methodologies required. Engine systems excel at isolated component analysis with superior control tolerances. Chassis dynos deliver full-vehicle performance observations. Roller systems emphasise real-world simulation capabilities.
Selecting the appropriate system aligns testing objectives with operational requirements and budget constraints, ensuring accurate, repeatable results for your performance evaluation goals.
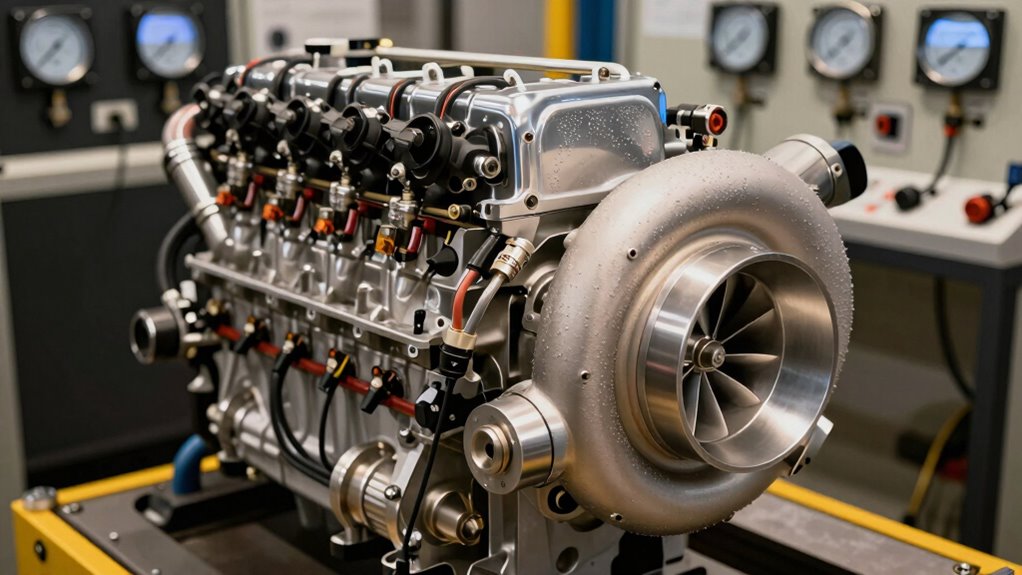
EV Dyno Types: Eddy Current, Water Brake, and AC Regenerative
When selecting a dynamometer for electric vehicle testing, operators encounter three primary absorption technologies, each offering distinct advantages in load control, response speed, and cost-effectiveness.
Eddy Current Advantages deliver millisecond load response, enabling rapid transient testing essential for EV emissions cycles. However, the narrower variable range and absence of motoring capability limit coast-down simulations. Eddy current dynamometers require specialised cooling systems to manage heat generated during absorption. These systems represent some of the latest advancements in dynamometer technology for precision performance testing.
Water Brake Limitations include slower load response and looser control tolerances, yet their versatility accommodates broad steady-state and sweep testing across all power ranges at lower cost.
AC Regenerative Benefits provide superior precision with ±2 RPM control, unique motoring capability for realistic road-load simulations, and energy recovery during efficiency testing. High inertia impacts acceleration performance.
EV Testing Applications require selecting based on horsepower range and test type. AC systems excel in advanced efficiency work; eddy current suits early development; water brake offers balanced versatility.
Setting Up Your Dyno Test: Sensors, Simulators, and Safety
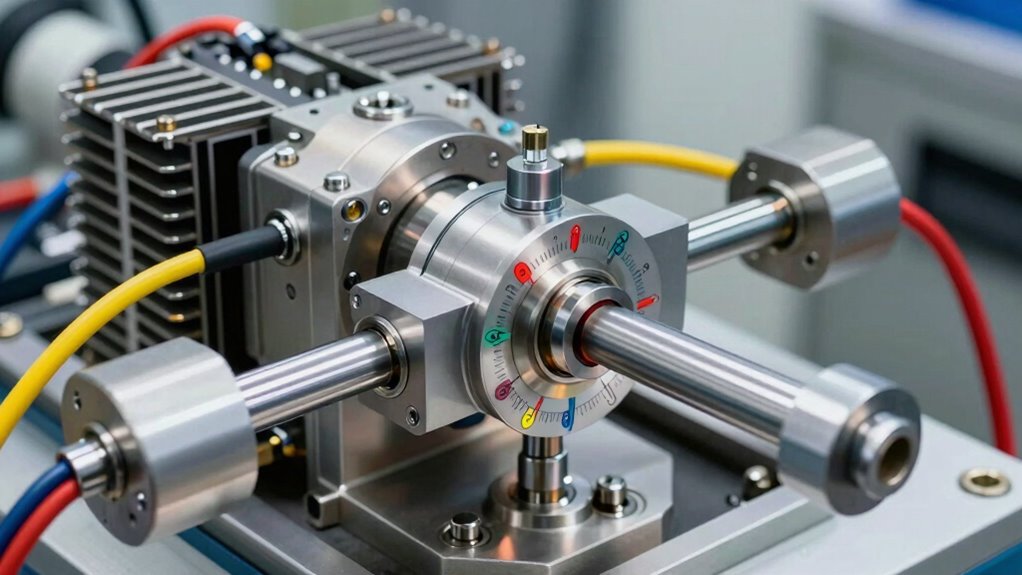
A properly configured EV dyno test requires precise sensor placement, accurate battery simulation, and strong safety measures working in concert to deliver reliable performance data.
Torque sensors, rotational speed sensors, voltage monitors, and current sensors must be strategically installed throughout the test setup to capture the electrical and mechanical variables that define electric vehicle performance. Modern dynamometers can simulate complex driving conditions, such as altitude changes and variable road loads, enabling comprehensive assessment of EV behaviour across diverse scenarios. Custom software solutions ensure that your testing setup aligns precisely with your specific performance requirements and vehicle configuration.
Establishing these foundational systems correctly guarantees both the validity of test results and the protection of expensive equipment and personnel during high-power testing cycles.
Essential Sensor Configuration
The foundation of accurate EV performance testing rests on properly selected and positioned sensors that capture the electrical and mechanical parameters of the vehicle under examination.
Current sensors, positioned on dyno hooks, monitor phase current and DC bus activity with precision. Voltage sensors at the motor controller input enable accurate voltage readings for reliable power calculations. Torque sensors, typically rotary types like Futek models, install between shafts to measure force transmission directly.
These integrated measurements require sensor calibration before testing begins, ensuring data synchronisation across all channels. Power analyzers provide the granular accuracy necessary for EV compliance testing. Regular software updates keep your dynamometer systems optimised for peak measurement reliability. Dynamometers also resist rotational motion to calculate the energy output and establish baseline performance metrics for comparative analysis.
Real-time DSP systems calculate cycle-based efficiency, while high-frequency logging at 3kHz captures fluctuating transients that conventional in-vehicle sensors cannot detect, establishing the electronic foundation for repeatable, scientifically valid performance data.
Battery Simulator Integration
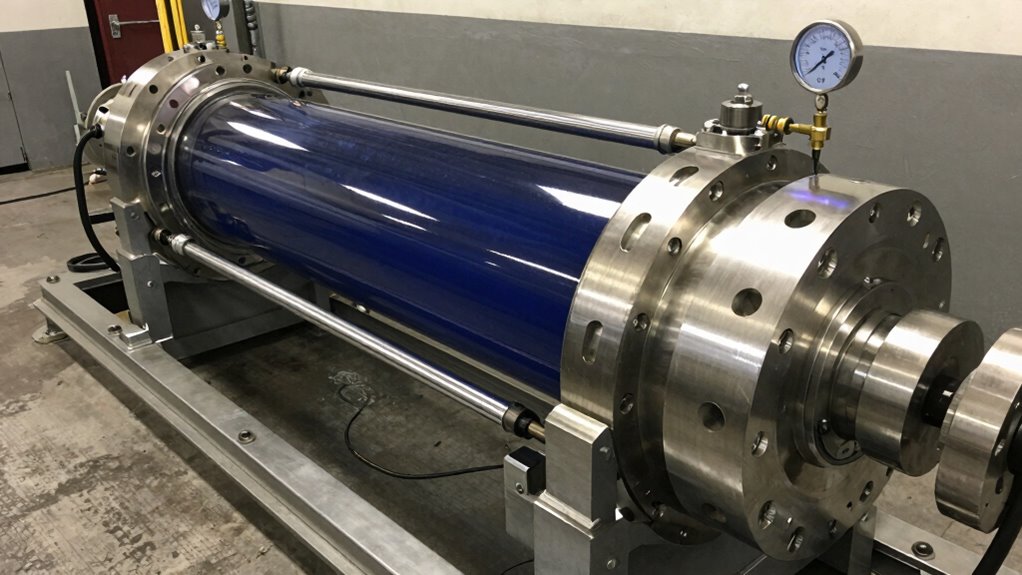
Once sensor data flows reliably through the dynamometer’s nervous system, the next layer of test sophistication involves replicating the battery’s electrical behaviour with precision.
A battery simulator connects directly to the dynamometer’s DC link, modelling any chemistry or capacity while eliminating the need for physical battery packs during extended testing.
This integration enables engineers to assess charge states, current drain, and voltage responses across varying resistance levels. The simulator accelerates battery lifecycle testing by compressing months of real-world degradation into controlled cycles, achieving high simulation accuracy through repeatable conditions.
Regenerative capabilities allow the dynamometer to power the simulator during discharge phases, recycling nearly all energy back to the grid.
This dual-system approach reduces test time remarkably while maintaining the electrical realism required for thorough powertrain validation and battery management system verification. Partnering with dynamometer specialists ensures advanced diagnostic tools and customised testing solutions are properly configured for your specific EV validation requirements.
Safety Protocol Implementation
Before operators commence any dynamometer testing sequence, establishing thorough safety protocols becomes non-negotiable, as the combination of high-speed rotating components, electrical systems, flammable fuels, and hazardous exhaust gases creates a complex risk environment that demands careful planning and execution.
Essential Safety Equipment
Extensive safety equipment forms the foundation of EV dyno operations. Ground Fault Circuit Interrupt (GFCI) outlets prevent electrical hazards throughout test cells, while fire extinguishers rated for petrol and oils remain readily accessible.
CO detectors monitor dangerous gas accumulation in both test and console areas.
Emergency Procedures
Emergency procedures require fuel supply shutdown capabilities positioned outside test cells for rapid response.
Source capture exhaust removal systems draw harmful contaminants directly from exhaust points, protecting technicians.
Operators must wear appropriate hearing and eye protection during high-intensity testing operations, ensuring extensive hazard mitigation. Professional installation and setup service establishes the foundation for safe and reliable dynamometer performance from the initial commissioning phase forward.
Running the Test: Protocols, Data Logging, and Real-Time Monitoring
Once the EV is secured on the dynamometer, executing the test requires careful adherence to protocol ramp and hold sequences that systematically measure performance across varying speed and torque conditions.
High-speed data logging systems, integral to Hyper Power’s Hyperwin4 software ecosystem, simultaneously capture torque, power, efficiency, and temperature data at millisecond intervals, ensuring no critical performance detail is missed.
This real-time monitoring capability allows operators to observe vehicle behaviour instantly, make informed adjustments during testing, and maintain the scientific validity essential for reproducible, industry-standard results. Strategic improvement planning derived from advanced data interpretation enables continuous optimisation of vehicle performance based on comprehensive testing insights.
Protocol Ramp And Hold Sequences
Dynamometer testing relies on carefully structured ramp and hold sequences to generate reliable performance data, with each element serving a specific function in the overall testing protocol.
Ramp strategies employ a linear acceleration over two seconds to reach target torque or speed, followed by a two-second hold period, then a controlled two-second ramp down. This three-phase approach guarantees mechanical stability and accurate measurements throughout the test cycle.
Hold durations verify fueling conditions under steady-state wide-open throttle, typically maintained up to 4,500 RPM to achieve precise lambda readings at 0.90.
The subsequent ramp run targets full throttle acceleration above 4,500 RPM with high ramp rates simulating lower gear performance. This sequential methodology captures thorough powertrain behaviour across the entire operating range.
Certified professionals leverage continuous learning resources to master these complex testing protocols and stay current with evolving dynamometer technology standards.
High-Speed Data Logging Systems
With ramp and hold sequences establishing the structural foundation for testing protocols, the actual collection and analysis of performance data becomes the next critical layer.
Modern EV dyno systems employ data synchronisation techniques operating at multiple rates, with standard 1kHz loops capturing motor torque, speed, temperature, and pressure parameters simultaneously. High-speed configurations reach 200kHz for wheel force transducers, ensuring every energetic interaction is recorded with precision.
Logging software advancements integrate seamlessly across platforms, automating data capture from start to stop RPM thresholds.
The 24-bit ADC resolution on load cell inputs delivers clinical accuracy, critical for validating motor efficiency claims. Real-time monitoring displays provide immediate post-test results, allowing engineers to verify performance metrics before proceeding to subsequent test cycles.
Because raw dynamometer readings represent only the foundation of meaningful performance analysis, the conversion of sensor data into actionable perceptions requires both systematic methodology and technical comprehension. Hyper Power’s Hyperwin4 software streamlines this translation through built-in algorithms, computing efficiency and power from voltage, current, and torque datasets. Data normalisation methods account for environmental variables, ensuring repeatable results across testing sessions. Our comprehensive selection of essential dynamometer accessories ensures that your measurement instruments maintain optimal calibration and precision throughout extended testing campaigns.
| Analysis Method |
Input Data |
Output |
Application |
| Bilinear Interpolation |
Torque-speed points |
Performance maps |
Gap filling |
| Levenberg-Marquardt Algorithm |
Coast-down curves |
Validation metrics |
Trend analysis |
| Template Comparison |
Motor variants |
Difference highlights |
Design optimisation |
| AI Prediction |
Historical datasets |
Performance trends |
Reliability forecasting |
Dyno calibration techniques verify sensor accuracy before testing begins. Heat-maps and efficiency contours visualise complex relationships, enabling engineers to identify optimisation opportunities within drivetrain systems.
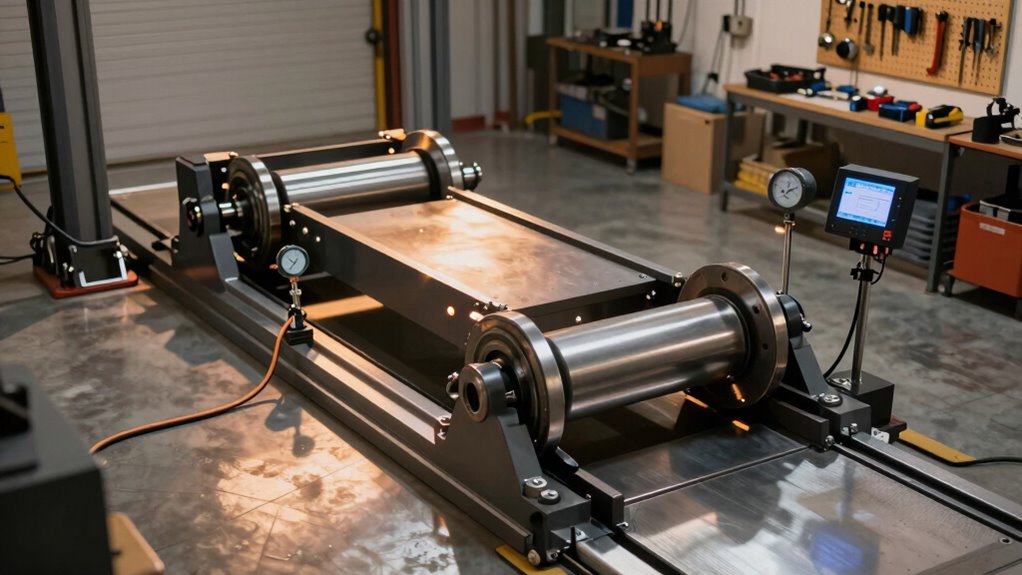
Running WLTP and EPA Cycles on Roller Dynos
To accurately measure electric vehicle efficiency and range, testing protocols must simulate real-world driving conditions with precision and repeatability.
The WLTP methodology spans 30 minutes across four speed phases, covering 23.25 km with a 46.5 km/h average speed, reflecting 52% urban and 48% highway driving.
The EPA standards employ a different approach, combining 45% urban UDDS cycles with 55% highway HWFET segments, running until complete battery depletion.
Testing Environment Consistency
Both cycle comparison methods require controlled laboratory conditions, with ambient temperatures ranging from -35°C to 55°C.
Vehicles undergo pre-test soak periods for stabilisation, then follow predefined speed traces exactly on roller dynamometers.
The EPA protocol is considered more rigorous and closer to actual U.S. driving patterns, while WLTP dominates European, Asian, and Australian markets, providing standardised range estimates across regions.
EV Dyno Data in Production: Quality Control and Safety Validation
Every electric vehicle that reaches the market must pass rigorous quality control and safety validation protocols, and dynamometer testing forms the backbone of this critical process. Performance metrics gathered during dyno runs provide manufacturers with essential data for guaranteeing vehicle reliability and safety compliance.
| Quality Assurance Parameter |
Validation Method |
| Insulation Resistance |
Megger Testing |
| Voltage Withstand |
Hi-Pot Testing |
| Phase Integrity |
Surge Detection |
| Thermal Performance |
Temperature Monitoring |
| Power Delivery |
4-Quadrant Operation |
Advanced dyno systems utilising SiC MOSFET technology and FPGA-based controls capture precise torque, efficiency, and speed measurements. Battery emulators simulate real-world conditions while regenerative systems verify power recycling functionality. These thorough tests guarantee every vehicle meets performance standards before implementation, protecting both manufacturers and drivers through data-driven validation protocols.