Why Your Dyno Numbers Are Lying to You
Your engine’s true horsepower might be a complete fiction. Every dyno test you’ve trusted is secretly corrupted by invisible atmospheric saboteurs—temperature, humidity, and barometric pressure conspire to distort your readings into meaningless noise. Two identical engines produce radically different results depending on what day you tested them. Most tuners ignore this entirely, chasing phantom gains that never materialise. Learn which correction factors separate real performance from illusion.
Why Raw Dyno Numbers Lie Without Weather Data?
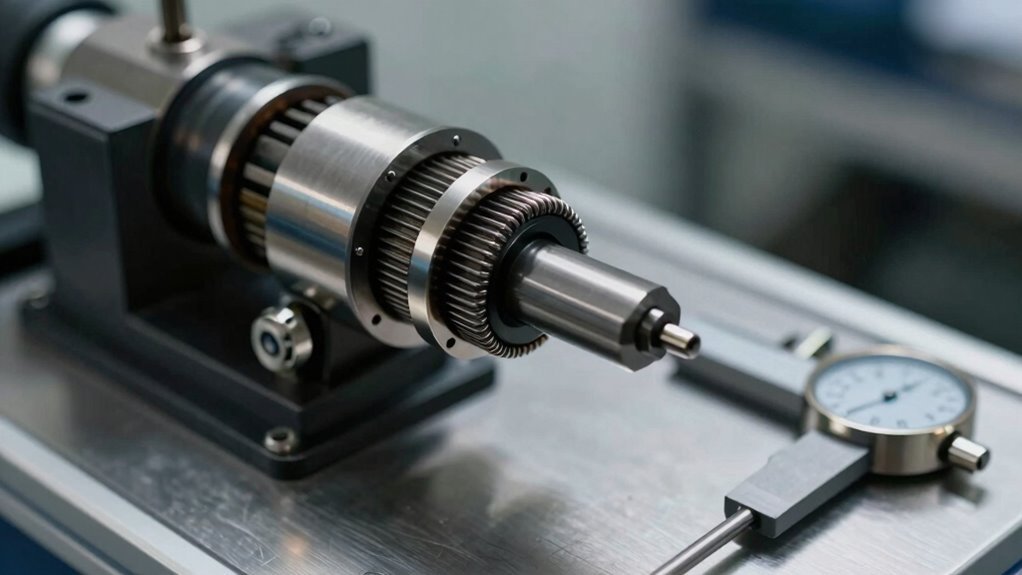
When an engine is tested on a dynamometer, the power readings displayed on screen represent only what that engine produces under the exact atmospheric conditions present at that moment.
These raw figures reflect real-time performance but create serious dyno accuracy problems when comparing tests across different days or locations.
Atmospheric effects dramatically influence engine output without any actual mechanical changes. On a hot, humid day with low barometric pressure, an engine inhales less dense air, consuming oxygen more sparingly and producing measurably lower power than identical conditions on a cooler day. Standard Temperature and Pressure (STP) conditions defined as sea-level pressure of 29.92 inHg, 68°F, and zero-percent humidity provide a baseline for correction factors that account for variables like pressure, temperature, and humidity. Our advanced diagnostics translate these complex atmospheric variables into actionable insights for precise performance evaluation.
Two identical vehicles have shown sixty horsepower variance solely from weather differences.
Without weather data circumstances, raw numbers mislead technicians evaluating modifications or tracking performance trends.
This inconsistency makes fair cross-comparisons impossible, undermining the reliability professionals need for confident decision-making.
Cold Air, Hot Air: How Weather Shifts Your Power Numbers?
Air density fluctuates dramatically with temperature, creating measurable differences in dyno readings that can mislead performance assessments without proper correction.
A 20-degree temperature drop increases air density enough to yield approximately 6 additional horsepower, while the inverse occurs during hot summer conditions when reduced oxygen availability suppresses power output by roughly 4 per cent.
Seasonal variations mean that identical vehicles tested in winter versus summer conditions will produce substantially different raw numbers, making standardised correction factors essential for accurate performance comparison. The dyno correction factor multiplies measured values by a specific amount determined by local atmospheric conditions to normalise results to SAE standard reference conditions of 77°F, 29.235 inches-Hg, and 0% humidity. At Hyper Power Hyperdyno, our cutting-edge software solutions automatically apply these critical atmospheric corrections to ensure your performance data remains reliable across all testing seasons.
Temperature’s Impact On Density
Because density directly determines how much oxygen enters an engine’s combustion chamber, even modest temperature swings can shift dynamometer readings by several horsepower. A 20-degree drop in inlet air temperature can produce measurable power gains through density fluctuations alone, without any mechanical modifications.
Warmer conditions reduce air density, decreasing available oxygen for combustion. A rise from 60°F to 100°F can lower dyno readings noticeably, masking an engine’s true potential. Conversely, colder air increases density, enabling more oxygen availability and higher power output.
Temperature corrections normalise these density fluctuations across different testing conditions. Proper temperature corrections adjust measured values to standard baselines—either SAE (77°F) or STD (60°F)—ensuring consistent, comparable results regardless of ambient weather. Correction factors may vary with each test due to changing conditions, requiring technicians to request both corrected and uncorrected numbers for accurate validation. At Hyper Power International, precision testing services are designed to ensure your dynamometer data accounts for all environmental variables affecting performance measurement.
This standardisation allows professionals to evaluate genuine performance improvements versus weather-induced variations.
Seasonal Variations Affect Output
Temperature corrections standardise dyno readings to predictable baselines, yet the real-world performance swings extend far beyond simple air density adjustments.
Cool dry days can enhance power output by up to 5.0% compared to hot humid conditions, creating significant seasonal variations in uncorrected readings.
Fuel blend effects compound these weather impacts substantially.
Winter blend petrol produces 5-7 foot pounds lower seasonal torque than summer formulations, while summer blends deliver measurable gains during late May through early June testing periods.
These seasonal fuel changes introduce an additional 4-7% power variance beyond weather corrections alone.
Professional dynamometer operators account for both variables simultaneously. Thousands of dyno tests with consistent fuel and controlled conditions reveal that switching petrol stations can introduce unexpected variables affecting horsepower comparisons between test runs. Our advanced testing methodologies ensure that environmental factors are systematically controlled to isolate genuine performance variations.
A race dyno standard at 60 degrees dry air produces higher power than SAE standards, ensuring accurate seasonal torque comparisons.
Proper correction factors isolate genuine performance changes from environmental noise, enabling consistent measurements year-round.
Which Dyno Correction Standard Do You Need?
When selecting a dyno correction standard, users must consider their specific application and regional requirements, as SAE J1349 dominates North American markets while STD and DIN standards serve racing and European industries respectively.
The choice between these standards directly impacts power readings—SAE typically yields approximately 4% lower results than STD due to its warmer reference conditions, making comparison across different correction methods essential for accurate performance assessment.
Comprehending which standard aligns with your testing goals, whether competitive racing benchmarks or regulatory compliance, guarantees that your dynamometer data remains both scientifically valid and relevant to your industry’s expectations. Uncorrected dyno results reflect the exact conditions at the time of testing without adjustments, making them more variable and influenced by weather, altitude, and atmospheric pressure.
SAE Versus Race Dyno
The choice between SAE J1349 and STD (SAE J607) correction standards represents one of the most consequential decisions in dynamometer testing, directly influencing how power figures are calculated, compared, and interpreted across the automotive industry.
SAE advantages lie in its realistic approach to ambient conditions. The J1349 standard employs 25°C temperatures and 29.23 inHg pressure, reflecting typical workshop environments and providing conservative power readings approximately 4% lower than STD.
Professional race teams and manufacturers prefer SAE for standardised comparisons, ensuring consistency regardless of location or weather conditions.
Race considerations often favour STD correction, particularly in NASCAR applications. The J607 standard’s cooler 15.5°C baseline and higher barometric pressure produce enhanced power numbers, facilitating chassis-to-engine dyno alignment.
Teams utilise STD for peak horsepower claims while utilising SAE for tuning validation and transparent performance assessment. Working with a dynamometer solutions provider ensures your testing methodology aligns with your performance goals and industry standards.
Global Standard Applications
Because automotive testing occurs across diverse geographic regions with vastly different climates and atmospheric conditions, selecting the appropriate correction standard becomes crucial for obtaining meaningful, comparable results.
Professionals benefit from comprehending three primary global standard applications:
- SAE J1349 – North American standard using 77°F, 29.235 inHg baseline; ideal for tuning shops across the continent.
- EEC/DIN – European standard at 68°F, 29.61 inHg; guarantees compliance and consistency across EU member countries.
- JIS – Japanese standard customised for regional climate conditions; essential for domestically manufactured engines.
Each standard accounts for specific regional climate variables affecting air density and engine performance.
Selecting the correct correction factor enables fair comparisons regardless of season or location, guaranteeing data repeatability and scientific validity.
Hyper Power’s Hyperwin4 software supports multiple standards, enabling workshops to meet international testing requirements with confidence and precision. Mastery of dynamometer technology through proper standard selection ensures professionals deliver reliable, internationally comparable results across all testing environments.
What Weather Data Do You Actually Need to Collect?
Why does environmental monitoring matter for dynamometer testing? Accurate weather data directly impacts dynamometer readings and guarantees repeatable, scientifically valid results across testing sessions.
Accurate weather data ensures repeatable, scientifically valid dynamometer results across multiple testing sessions.
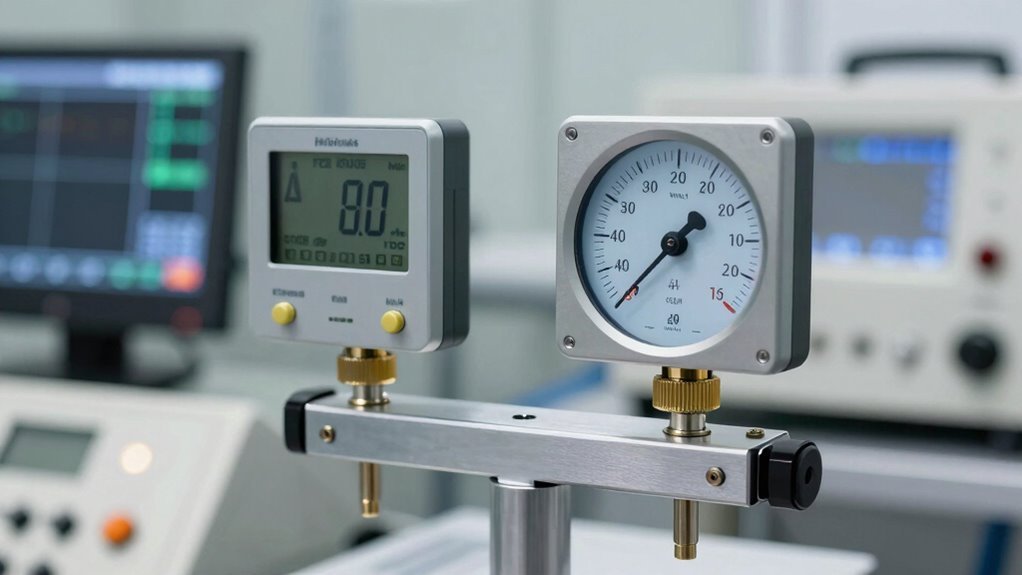
The essential measurements include air temperature, atmospheric pressure, and humidity levels. These three variables fundamentally affect engine performance and must be captured with precision. Temperature readings should come from standardised locations using programmed sensors that convert environmental data into electronic signals for database storage.
Atmospheric pressure relates directly to air density, which influences combustion efficiency and power output. Humidity similarly affects engine performance characteristics.
Professional dynamometer facilities employ integrated weather stations that simultaneously capture all environmental parameters, enabling proper correction factors during data analysis and guaranteeing consistent benchmark comparisons between different test dates and conditions. Regular software updates ensure your weather station maintains accuracy and compatibility with your dynamometer system’s evolving requirements.
Once environmental data has been collected through integrated weather stations, that raw information changes into actionable corrections that standardise dynamometer readings across different testing conditions. The correction factor calculations alter measured conditions into standardised baselines, enabling meaningful dyno data interpretation.
The mathematical process involves three primary steps:
- Vapour pressure subtraction from barometric pressure to determine dry air pressure used in calculations
- Multiplier application to raw horsepower and torque readings based on current environmental variables
- Standard comparison against established baselines like SAE or STD specifications
These calculations account for temperature, pressure, humidity, and altitude simultaneously. Custom software solutions ensure that correction factor algorithms align precisely with your specific testing requirements and performance expectations.
Skip Manual Entry: Why Automated Weather Stations Win
While manual weather data collection has long served dynamometer facilities, mechanised weather stations represent a fundamental shift in how environmental variables are captured and integrated into correction factor calculations.
Automated efficiency eliminates human error inherent in manual logging, where timing mistakes and subjective readings compromise test validity.
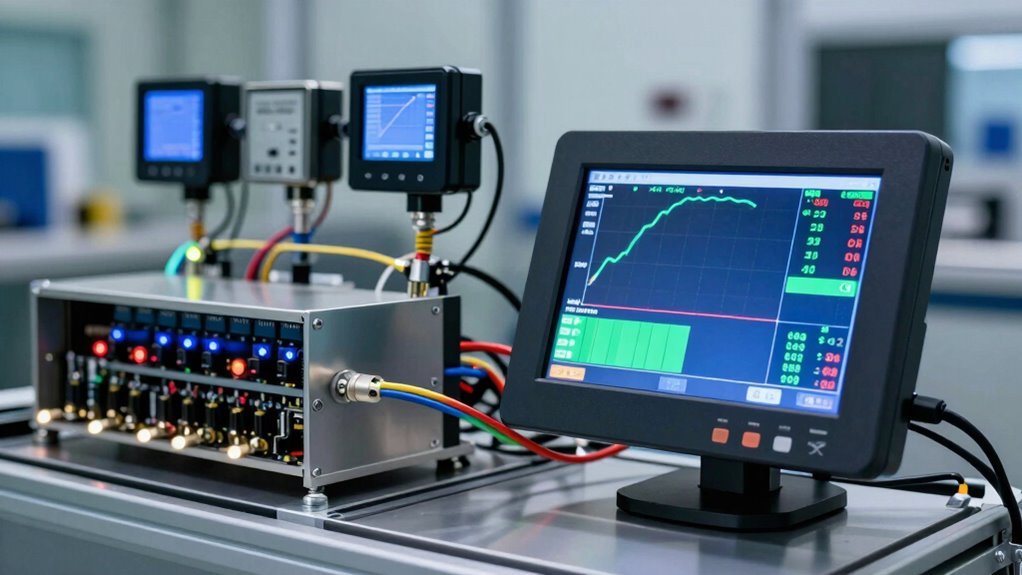
Electronic sensors convert atmospheric conditions into precise electrical signals, ensuring data reliability across consecutive testing cycles. These systems operate continuously, capturing measurements during snowfall, humidity fluctuations, and temperature swings without operator intervention.
Cloud-connected stations enable real-time access to environmental data, allowing technicians to correlate dyno results with exact atmospheric conditions instantaneously.
The initial £2,000–£10,000 investment yields substantial long-term savings through reduced labour costs and improved measurement consistency.
For facilities seeking competitive advantage, automated weather integration alters correction factor accuracy into a measurable competitive edge.
When weather conditions shift between test sessions, uncorrected dyno data can mask genuine engine improvements beneath environmental noise.
Corrected horsepower values isolate true performance gains by filtering out temperature, pressure, and humidity variations that naturally occur across days and seasons.
This distinction proves critical for technicians validating modification effectiveness, as corrected data reveals whether actual mechanical changes—not atmospheric conditions—drove measured power increases.
Isolating True Engine Modifications
Every dynamometer session produces raw power and torque figures, but these readings reflect only what occurred on that specific day under those specific atmospheric conditions.
Isolating true engine modifications requires stripping away environmental variables that mask genuine performance validation. SAE correction standardises these measurements, revealing what modifications actually accomplish versus what weather contributes.
Consider these validation markers:
- Identical corrected horsepower across multiple test days confirms modification effectiveness, not atmospheric luck.
- Raw data variance of 6–10 hp from temperature and humidity changes alone disappears with SAE correction.
- Before-and-after corrected comparisons isolate specific parts like headers or intake systems from environmental noise.
Professional tuning shops use SAE J1349 benchmarking to document legitimate performance gains. When corrected numbers remain consistent, engineers validate that modifications deliver repeatable results. Investing in expert calibration techniques during installation ensures your dynamometer produces the precise, standardised data necessary for this validation process.
This standardisation separates genuine engineering improvements from misleading raw readings, establishing credibility within the performance community.
Most dynamometer operators recognise that raw power numbers fluctuate between test sessions, yet many attribute these variations solely to mechanical changes rather than investigating their true source. Environmental calibration modifies uncorrected data into reliable measurements by accounting for atmospheric interference.
Weather conditions create significant performance noise. Temperature shifts, barometric pressure changes, and humidity variations directly alter air density, producing horsepower fluctuations unrelated to engine modifications. A 20-degree temperature difference generates measurable power loss on identical engines, while seasonal testing reveals substantial discrepancies without correction. Hyper Power’s comprehensive technical support ensures your dynamometer systems account for these environmental variables with precision calibration.
| Condition |
Uncorrected Impact |
Corrected Result |
Benefit |
| Cold Winter Day |
Lower readings |
Standardised data |
True comparison |
| High Pressure |
Inflated numbers |
Normalised output |
Accurate gains |
| Humidity Variation |
Inconsistent results |
Stable baseline |
Reliable trends |
| Seasonal Changes |
Misleading outcomes |
Valid analysis |
Confidence in modifications |
Data normalisation applies mathematical formulas to standardise conditions, enabling meaningful comparisons across locations and timeframes. Corrected dyno runs distinguish genuine performance improvements from environmental variations, ensuring operators confidently identify actual engine benefits.
Weather Station Mistakes That Tank Your Correction Accuracy
Why do dynamometer correction factors sometimes produce wildly inconsistent results, even when operators follow established protocols? The answer lies in common weather station installation and maintenance oversights that undermine data accuracy.
Three critical mistakes compromise correction factor reliability:
- Poor sensor placement near large structures, power lines, or pollution sources distorts readings through electromagnetic interference and environmental contamination.
- Inadequate sensor shielding causes temperature discrepancies of 1-2 degrees Celsius, throwing correction calculations considerably off.
- Neglected maintenance schedules allow dust accumulation and component degradation, reducing sensor sensitivity over time.
Professional dynamometer operations demand careful attention to station location, protective equipment, and regular calibration.
Facilities must establish routine maintenance protocols and position sensors away from environmental interference.
This foundational discipline guarantees correction factors reflect true atmospheric conditions, providing repeatable, scientifically valid test results that drive automotive innovation forward.
Validate Your Weather Station Accuracy: Testing Methods
Correcting dynamometer results depends entirely on the quality of the atmospheric data feeding into those correction calculations. Professional operators employ systematic validation techniques to guarantee sensor calibration meets industry standards, directly protecting data accuracy across all performance measurements.
| Testing Method |
Purpose |
Expected Accuracy |
| Aspirated Shield Comparison |
Temperature sensor validation |
±0.6°C confidence interval |
| Dual Humidity Sensors |
RH verification using independent types |
Consistent vapour pressure readings |
| Pyranometer Cross-Verification |
Solar radiation calibration against clear-sky envelope |
Reliable radiation measurements |
| Anemometer Simultaneous Testing |
Wind speed accuracy between ultrasonic and mechanical units |
Inertia-free performance data |
Ground truth data from nearby stations accounts for microclimate variations, establishing baselines for sensor performance evaluation. Systematic archiving with time-stamps and geographic tags enables meaningful forecast comparisons, guaranteeing every correction factor reflects genuine atmospheric conditions rather than equipment drift or installation errors.
Install and Calibrate Your Weather Sensors
Before mounting any sensor hardware, operators must complete essential preparation work that directly impacts data quality and system reliability. This foundational phase guarantees accurate measurements that support valid dynamometer testing protocols.
Essential Preparation Requirements:
- Unpack components and review manufacturer instructions for model-specific guidance.
- Gather required tools including screws, mounts, ladder, compass, and hardware bag.
- Check battery guidelines; use 4 AA batteries, avoiding heavy-duty or rechargeable types.
Sensor Installation and Calibration Techniques****
Position anemometers at 10 metres height above obstructions. Mount temperature and humidity sensors 1.5-2 metres above ground over grass. Secure all sensors using appropriate hardware, maintaining level alignment with bubble levels.
For calibration techniques, set the A-B-C switch to matching channels between sensor and display units. Reinstall batteries in sensors first, then display units after channel matching.
Verify wireless range operates within 300-1,000 feet for reliable data transmission.